Accountable publisher
Published under the RTX5 Editorial Team byline. It identifies the responsible publishing organization; it does not imply that a named lawyer, regulator, financial adviser, or licensed expert approved this page.
Research tools
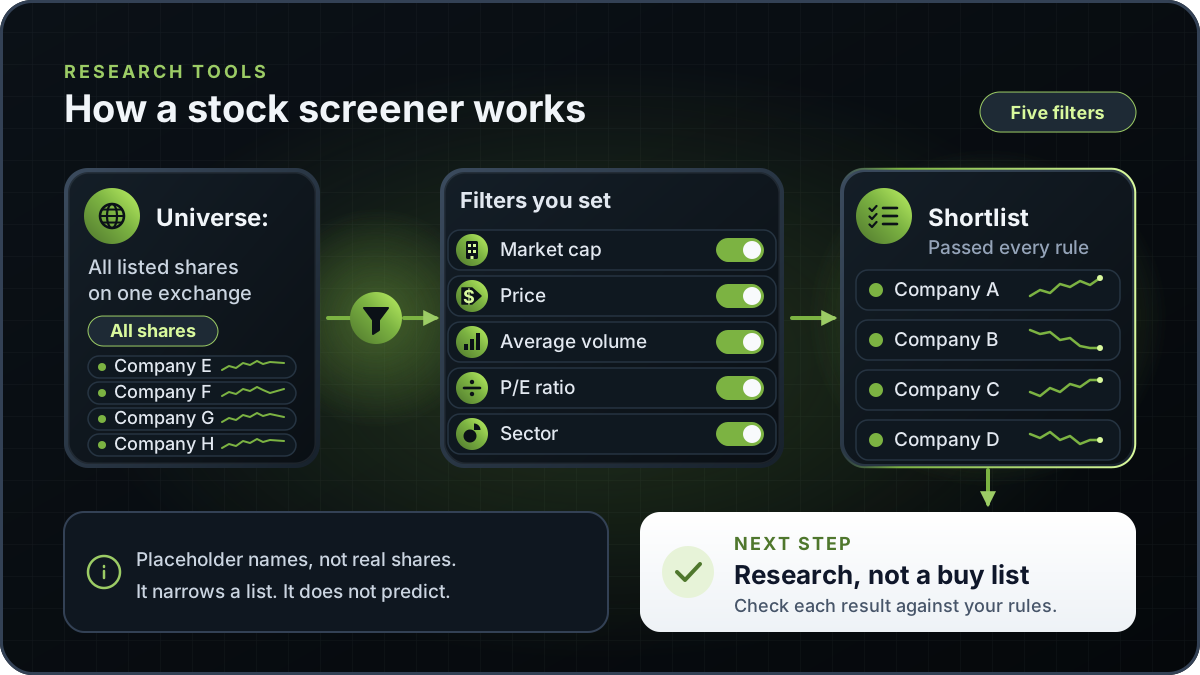
A stock screener is a tool that filters a large list of shares, such as every company on one exchange, against criteria you set. Typical criteria include market capitalisation, price, average volume, P/E ratio and dividend yield. The output is a shortlist for further research, not a buy signal.
In brief
A list of screener stocks is only as good as the rules you set and the data behind it.
A stock screener starts with a universe: the set of shares it is allowed to search. Each filter is a yes-or-no test. A company that fails any test drops out, and the companies that pass all of them form the shortlist. The method is simple. The judgement lies in choosing the tests and reading the results.
Most stock screener tools are web or app based, and many brokers and data providers include one. People searching for screener stocks usually want either a ready-made list that matches a set of rules, or a tool that builds one. Either way, the list is only as good as its data and rules.
For a comparison of Android apps that offer screening, see our guide to stock screener apps for Android. Check each tool's coverage and data timing yourself.
Pick the exchange, country or index to search. Companies in different markets use different reporting rules, currencies and trading hours. Confirm exactly which exchanges and companies the tool covers.
Start with two or three filters, such as a minimum average volume and a price range. Each extra filter narrows the list further. Add another only if you can say what it measures and why it matters.
Sort by one measure at a time, such as market capitalisation or dividend yield, to see how the shortlist is ordered. Sorting changes the display only. It does not change which companies passed.
Open each company's filings, price history and recent news. Check whether the figures are current and whether one-off items distort them. A screen cannot tell you whether a business is sound.
Save the filter set so you can run the same test again, and note the date of each run. A shortlist from last quarter may not match current prices or newly reported earnings.
If your tool sends alerts when a company newly matches a screen, treat each one as a prompt for research, not a trade signal. For how alerts are described on this site, see alerts, and check the RTX5 status first.
These filters appear in most stock screener tools. The definitions are general. Your tool may use its own formula, period or data provider, so read its help text before you rely on a result.
| Filter | Plain definition | Watch out for |
|---|---|---|
| Market capitalisation | The market value of a company's shares, commonly calculated as outstanding shares multiplied by the current market price. | Size bands have no fixed cutoffs. FINRA states there are no fixed cutoff points for large-, mid- or small-cap companies. |
| Price | The current share price, used to set a minimum or maximum. | A low share price does not make a stock cheap. Check the currency and whether the price is adjusted for corporate actions. |
| Average volume | The typical number of shares traded per day over a set period. | Thin trading can make it hard to trade near the quoted price. Check the period used. |
| P/E ratio | A valuation ratio that compares the share price with the company's earnings per share over a stated period. | Earnings can be negative, one-off or from a different period from the price. Compare within a sector. |
| Dividend yield | The annual cash dividend a company pays, expressed as a percentage of its share price. | A high yield can follow a fall in the share price. FINRA says a common stock dividend is not assured and can be cut or eliminated. |
| Sector | The industry group a company belongs to. | Data providers classify sectors differently. Check which classification your tool uses. |
| Moving-average and technical filters | Rules based on past prices, such as a share price above its 50-day average. | They describe past price behaviour, not business quality, and a moving average lags the price. Test over more than one period. |
| Earnings date | The date the company is scheduled to report its results. | Results can move the price sharply. Check whether the date is confirmed or estimated. |
Definitions are general. Figures in any screen depend on the data provider and the reporting period used.
A company with a share price of US$50 and 20 million shares outstanding has a market value of US$1 billion (US$50 x 20,000,000). FINRA gives less than US$2 billion as one rough example of a small-cap company, says the figures may be higher, and states there are no fixed cutoffs. Your account currency may differ, but the arithmetic is the same.
A screen combines two kinds of data that change at different speeds. Share prices move with every trade. Company financials change only when the company reports them, so a screen can show a current price next to a figure that is months old.
Check whether the tool shows real-time or delayed quotes, and read the timestamp on every result. How long a quote is delayed depends on the tool, the data provider and the exchange, so check the provider's terms.
Reporting periods matter as much as the price. A P/E ratio based on the last twelve months of earnings changes when a new quarter is reported. The SEC's EDGAR full-text search covers electronic filings since 2001, which is one place to check the figures behind a screen.
A screener applies rules to data. It cannot judge management quality, competitive position, legal disputes or future earnings. It also cannot know your tax position, account currency, time horizon or how much loss you can accept.
Errors in company data, delayed updates and differences in how providers calculate ratios flow into the shortlist without warning. An empty result may also mean a filter was set too tightly, not that there are no opportunities.
Fundamental screens use company financials and valuation measures. Technical screens use prices and trading volume. The table compares them.
| Aspect | Fundamental screen | Technical screen |
|---|---|---|
| Typical inputs | Earnings, revenue, balance sheet items, dividends, valuation ratios and sector | Share price, trading volume, moving averages and price momentum |
| Question it answers | Does the company's financial profile or valuation fit what I am looking for? | Has the share price behaved in the way I am looking for? |
| How often inputs change | When the company reports its results | With every trade or price bar |
| Main risk | Stale or differently calculated financial figures | Rules that fitted past price behaviour and may not repeat |
Many people combine both: a fundamental filter for financial profile, then a technical filter for timing. Read more in fundamental analysis and technical analysis. Each extra filter narrows the list, so the overfitting warning above applies.
RTX5 does not publish a released stock screener. RTX5 is Orrnn's trading terminal and broker-technology product. Its Windows desktop client is in preview, and the web and mobile clients are planned. A Google Play listing for Android is published, but the mobile client has no approved release record yet. Check the product-availability record and release notes before relying on any RTX5 feature.
Check RTX5 product availabilityTrust and methodology
We want you to be able to identify who owns the page, inspect the evidence, understand how tools were used, and challenge anything that looks wrong or out of date.
Published under the RTX5 Editorial Team byline. It identifies the responsible publishing organization; it does not imply that a named lawyer, regulator, financial adviser, or licensed expert approved this page.
4 primary references are listed on this page with context about what each one supports. The source set was checked on .
Automation and AI may help organize research, outline a page, or edit language. They are not treated as sources, are not presented as human experts, and do not remove the publisher's responsibility for the final page.
If a statement is incomplete, unsupported, or outdated, send the exact URL, sentence, and supporting evidence through our contact route. Read the full editorial and corrections policy.
Sources were checked on 7 November 2026. They explain market rules and concepts; they do not certify RTX5 or provide individual financial advice.
A stock screener narrows a large list of shares to a smaller set that meets rules you define, such as a minimum market capitalisation or a range for the P/E ratio. It saves time compared with checking every company by hand. It does not tell you whether a company is a good investment, so each result still needs its own research.
No. A list of screener stocks is the output of rules you chose, using data that may be delayed or out of date. Passing a screen does not mean a company is sound, cheap or likely to rise. Treat the list as a starting point for research into the business, its filings and its risks.
Start with a universe you understand, then add one liquidity filter, such as minimum average volume, and one size filter, such as market capitalisation. Add valuation ratios like the P/E ratio only after you understand how the earnings in your data were reported. Fewer filters are easier to check and less likely to overfit.
Some do and some do not. Whether quotes are delayed depends on the tool, the data provider and the exchange. Financial data changes only when a company reports, so a screen can show a current price next to outdated earnings. Check the timestamp on every figure before you act on it.
No. RTX5 does not publish a released stock screener. RTX5 is a trading terminal and broker-technology product whose Windows desktop client is in preview, while the web and mobile clients are planned. A Google Play listing for Android is published, but the mobile client has no approved release record yet. If you need a screener today, use a dedicated screening tool and treat its results as research. Check the product availability record and release notes before relying on any RTX5 feature.