Accountable publisher
Published under the RTX5 Editorial Team byline. It identifies the responsible publishing organization; it does not imply that a named lawyer, regulator, financial adviser, or licensed expert approved this page.
Trading glossary
The risk reward ratio compares how much you stand to gain with how much you stand to lose on a trade. For a long position it is the distance from entry to target divided by the distance from entry to stop. It describes a trade's shape, not its chance of success.
In brief
A risk reward ratio compares the planned gain with the planned loss on one trade. Here is the formula for long and short positions, a worked example tied to a fixed account risk, and what the ratio leaves out.
The ratio needs two distances, both measured from your entry price. Reward is the distance to the target, the price at which you plan to take profit. Risk is the distance to the stop, the price at which you plan to exit at a loss. Both are per unit of the instrument. Traders often write the ratio as r/r or rr ratio. Take-profit orders and stop-loss orders set those prices with your broker or platform.
Long: reward = target - entry; risk = entry - stop; ratio = reward / risk. Short: reward = entry - target; risk = stop - entry; ratio = reward / risk. Write the ratio as reward to risk, such as 3:1, or as the single number 3.
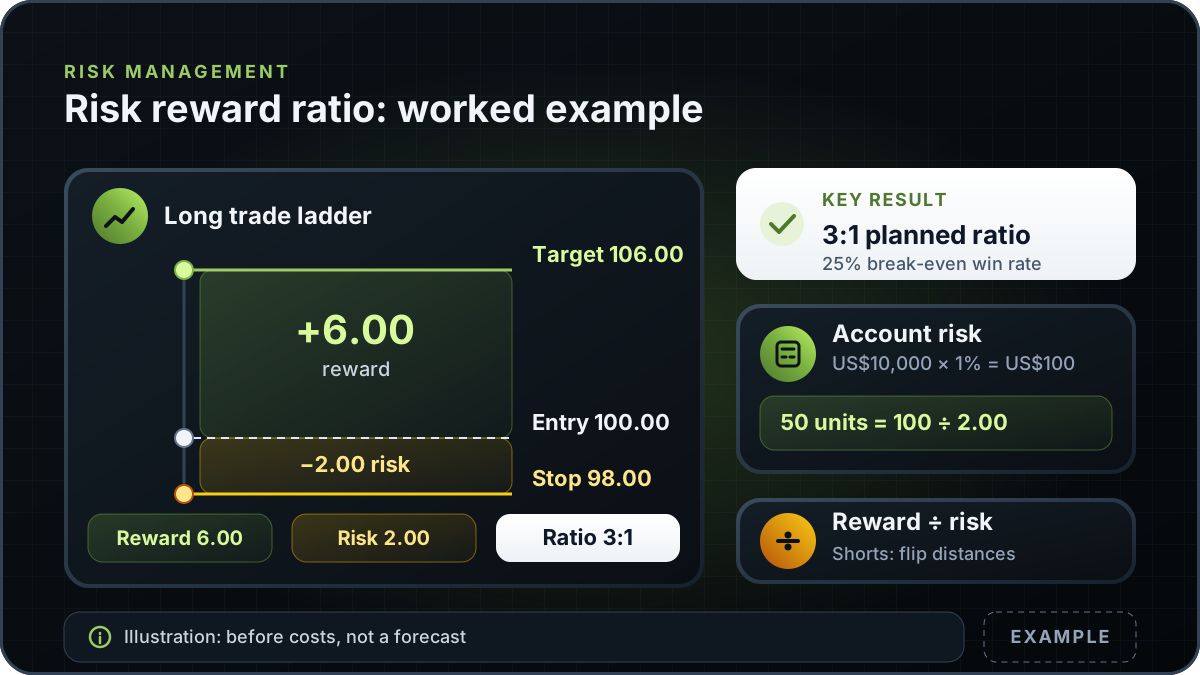
This is an Example, not a recommendation or a forecast. Suppose you buy at an entry of 100.00, with a stop at 98.00 and a target at 106.00. Reward is 106.00 - 100.00 = 6.00. Risk is 100.00 - 98.00 = 2.00. The ratio is 6.00 / 2.00 = 3, or 3:1.
Now tie the trade to a fixed account risk. Assume an account of US$10,000 and a plan to risk 1% on this trade, which is US$100. Each unit loses 2.00 if the stop is reached, before costs, so the position is 100 / 2.00 = 50 units. At the stop the planned loss is 50 x 2.00 = US$100. At the target the planned gain is 50 x 6.00 = US$300, again before costs.
The position size, not the ratio alone, decides the money at risk. The same 3:1 trade with a 1% account risk on a larger stop distance would use fewer units. Use the position size calculator to run the same arithmetic for your own account currency and instrument.
Suppose each trade ends either at the target or at the stop, and costs are ignored. Let R be the ratio, with the risk set to 1 unit and the reward set to R units. Then the expected result per trade is p x R - (1 - p) x 1, where p is the share of trades that reach the target. That expected result is zero when p = 1 / (1 + R).
This is a piece of arithmetic. It does not say what share of trades any trader wins, and it does not show that any ratio will be profitable. Real trades have costs, and real exits can differ from the planned levels.
Read the table as the break-even point before costs under those assumptions. Spreads, commissions and financing charges move the break-even point up. Slippage and gaps can move it further.
For a short, the target sits below the entry and the stop sits above it. Suppose you sell at 50.00, with a stop at 52.00 and a target at 44.00. Reward is 50.00 - 44.00 = 6.00. Risk is 52.00 - 50.00 = 2.00. The ratio is 3:1, the same as the long example, and the formula is reversed.
With the same US$10,000 account and a 1% risk of US$100, the position is 100 / 2.00 = 50 units. The planned loss at the stop is US$100 and the planned gain at the target is US$300, before costs. Check the side of the order before you submit it, because a sell and a buy are not interchangeable.
The ratio is one input to a trade plan. The table lists what it leaves out, and where to read more before you rely on the number.
| Missing from the ratio | Why it matters | Where to read more |
|---|---|---|
| Probability | The ratio does not say how often the target or the stop is reached. A high ratio can still be reached rarely. | The break-even arithmetic above, which uses a win rate only as a formula. |
| Costs | Spread, commission and financing reduce the reward and add to the risk, so the realised ratio is lower than the planned one. | Your broker's or provider's published spread, commission and financing schedule. |
| Slippage and gaps | Once triggered, a stop can fill away from its planned price, so the realised loss can exceed the planned risk. | The stop-loss order guide linked in the formula section. |
| Position size | The ratio ignores how many units you trade. The money at risk depends on the units and the stop distance. | The position size calculator linked in the worked example. |
| Level quality | Targets and stops are inputs you choose. A 3:1 ratio on an arbitrary level is still arbitrary. | Risk management. |
The rows describe the ratio's limits. They do not estimate any probability or cost for a specific market.
RTX5 is Orrnn's trading terminal and broker-technology product. Its Windows desktop client is in preview, and the web and mobile clients are planned. A Google Play listing for Android is published, but the mobile client has no approved release record yet; check the product-availability record before relying on any RTX5 feature. The ratio and position-size examples on this page are illustrative and do not come from an RTX5 feature.
Check RTX5 product availabilityTrust and methodology
We want you to be able to identify who owns the page, inspect the evidence, understand how tools were used, and challenge anything that looks wrong or out of date.
Published under the RTX5 Editorial Team byline. It identifies the responsible publishing organization; it does not imply that a named lawyer, regulator, financial adviser, or licensed expert approved this page.
3 primary references are listed on this page with context about what each one supports. The source set was checked on .
Automation and AI may help organize research, outline a page, or edit language. They are not treated as sources, are not presented as human experts, and do not remove the publisher's responsibility for the final page.
If a statement is incomplete, unsupported, or outdated, send the exact URL, sentence, and supporting evidence through our contact route. Read the full editorial and corrections policy.
Sources were checked on 9 November 2026. They explain market rules and concepts; they do not certify RTX5 or provide individual financial advice.
No single ratio is good for every trade. A ratio describes the planned reward and risk on one trade, but it does not say how often the target or stop will be reached, or what the costs are. Some traders use a minimum ratio as a plan rule, but that rule is a choice, not a measure of quality. Test any rule against your own records and costs before relying on it.
Not by itself. A higher ratio usually means a larger planned target relative to the stop, and that target may be reached less often. The ratio can look attractive while the trade has a poor chance of reaching the target. Read the ratio together with the probability of each outcome, the costs and the size of the loss in your account currency.
Under simple assumptions, the break-even share of winning trades is 1 / (1 + R), where R is the ratio. A 2:1 ratio gives 33.3% and a 3:1 ratio gives 25%, before costs. This is arithmetic, not a prediction, and it does not show that any trader reaches that win rate. Costs and slippage raise the break-even point.
No. The ratio compares the planned gain with the planned loss per unit. Position size sets how many units you trade, and that decides the money at risk in your account. A 3:1 ratio with a large position can risk more than a 1:1 ratio with a small one. Use a position size calculator to link the stop distance to a fixed account risk.
No. A stop sets a planned exit, and the ratio uses only the planned prices. The realised loss and gain can differ from those figures, so the realised ratio can differ too. The stop-loss order guide linked above explains how stop orders trigger and fill, and you should check your broker's rules before you rely on the planned figure.