Accountable publisher
Published under the RTX5 Editorial Team byline. It identifies the responsible publishing organization; it does not imply that a named lawyer, regulator, financial adviser, or licensed expert approved this page.
Volatility indicator
Average true range (ATR) is a volatility indicator that averages each bar's true range, with 14 periods the SharpCharts default. True range is the greatest of the high minus the low, the high minus the previous close, and the low minus the previous close. J. Welles Wilder introduced ATR in 1978. It measures volatility in price units, not direction.
In brief
ATR tells you how much price has been moving per bar, in price units. It does not tell you which way price will move, so it is a yardstick for stop distance and position size rather than a signal.
A simple range is the high minus the low of one bar. It misses movement between bars. If the market gaps up at the open, the bar's high-low range can look small even though price has moved a long way from the prior close. True range fixes this by also counting the distance from the previous close.
ATR is the moving average of true range. J. Welles Wilder introduced it in his book New Concepts in Technical Trading Systems (1978), and the StockCharts ChartSchool and MetaTrader 5 help pages both credit him with it. ATR is best understood as an average size of bar movement. It is not a trend tool.
True range (TR) is defined as the greatest of three values. The first is the current high minus the current low. The second is the absolute value of the current high minus the previous close. The third is the absolute value of the current low minus the previous close. The StockCharts ChartSchool and MetaTrader 5 help pages state the same three-part rule.
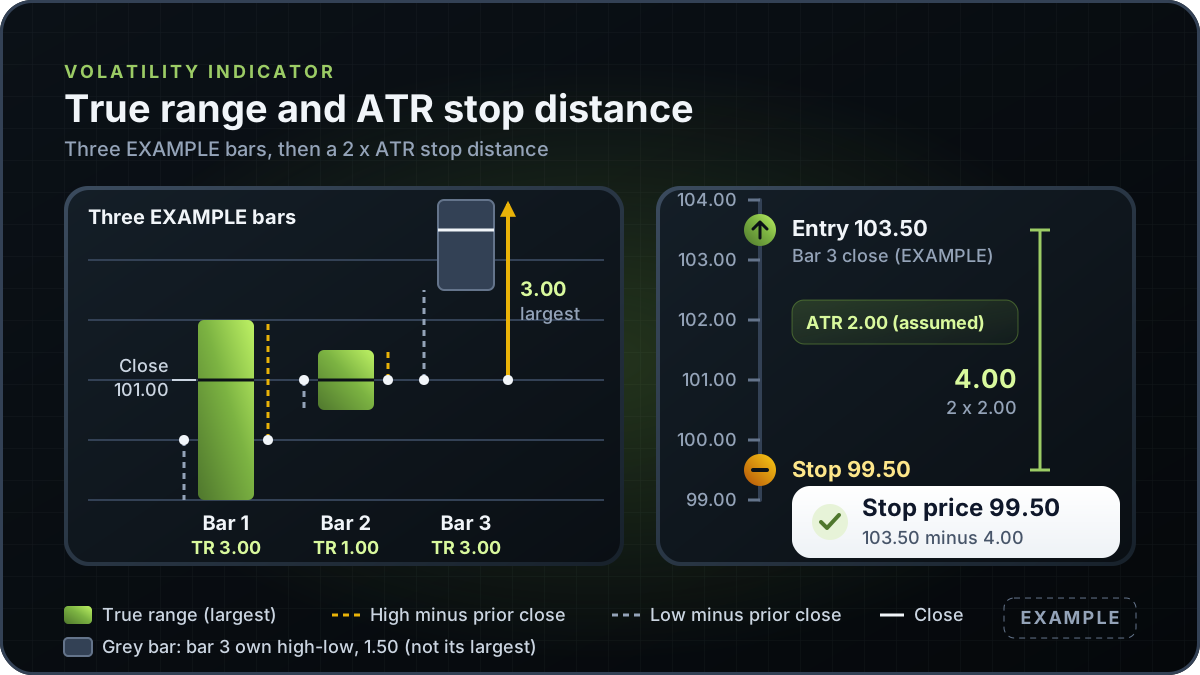
The table uses three EXAMPLE bars with made-up prices. Each row computes the three candidates and keeps the largest. Bar 1's prior close is an EXAMPLE 100.00, and each later bar's prior close is the previous bar's close.
| Bar | High / low | Close | Prior close | High minus low | High minus prior close | Low minus prior close | True range (largest) |
|---|---|---|---|---|---|---|---|
| Bar 1 | 102.00 / 99.00 | 101.00 | 100.00 | 3.00 | 2.00 | 1.00 | 3.00 |
| Bar 2 | 101.50 / 100.50 | 101.00 | 101.00 | 1.00 | 0.50 | 0.50 | 1.00 |
| Bar 3 | 104.00 / 102.50 | 103.50 | 101.00 | 1.50 | 3.00 | 1.50 | 3.00 |
Example arithmetic. The closes match the diagram's close markers. Bar 3 is a gap-up case: the largest value comes from the high minus the prior close, not from the bar's own range.
Bar 1 has a true range of 3.00 from its own high-low range. Bar 2 is 1.00 from its own range, because it sits inside the prior bar's span. Bar 3 is 3.00, even though its own range is only 1.50, because the prior close of 101.00 sits well below the 104.00 high.
The first 14-day ATR is the average of the first 14 true range values. After that, the StockCharts ChartSchool page gives the smoothing rule as Current ATR = [(Prior ATR x 13) + Current TR] / 14.
Example: suppose the prior ATR is 2.00 and the new bar's true range is 3.00. The new ATR is (2.00 x 13 + 3.00) / 14 = 29 / 14 = 2.07, rounded to two decimals.
Platforms can seed the average differently or use another smoothing method, so check your platform's settings and help page before comparing values.
Some traders set a stop a multiple of ATR from entry. This example uses 2 x ATR. The 2 x multiple is an example value chosen for this page. Neither reference gives it, and it is not a recommended default. Neither reference states the stop arithmetic either, so the calculation below is shown as an illustration.
Because the three bars above are too few to form a 14-period ATR, the example takes an ATR of 2.00 as a stated assumption. Example: a long trade enters at 103.50, the close of bar 3. The stop distance is 2 x 2.00 = 4.00 price units, so the stop sits at 103.50 minus 4.00 = 99.50. The stop-loss order guide explains how a stop order behaves once price reaches that level.
The ATR figure sets where the stop sits. It says nothing about whether the trade is sound.
Once the stop distance is set, the amount you accept to lose sets the position size. Example: a US$10,000 account risking 1% has US$100 at risk. The stop distance is 4.00 price units per share, so the share count is 100 / 4.00 = 25 shares. At a 99.50 stop, the planned loss is 25 x 4.00 = US$100. Dividing the risk amount by the stop distance is simple arithmetic, and no reference above states it.
The position size calculator uses the same division for stock shares. Its Stock shares mode takes an entry price and a stop price, so enter 103.50 and 99.50. It has no ATR input, so you work out the ATR and the multiple yourself. Its page says: "Results are estimates before spreads, commissions, financing and slippage."
The two references agree on the true range rule and Wilder's authorship. They differ on interpretation. StockCharts says ATR "doesn't indicate price direction, just volatility". The MetaTrader 5 help page links high readings to market bottoms and to a higher probability of a trend change. This guide does not treat those readings as signals.
| Point | StockCharts ChartSchool | MetaTrader 5 help (ATR) |
|---|---|---|
| True range definition | Greatest of high minus low, high minus prior close, and low minus prior close | Greatest of the same three values |
| Default period | 14 periods, the default shown in SharpCharts | Not stated on the help page |
| Period variant | The page also says Wilder often used an 8-period ATR | Not stated on the help page |
| Smoothing rule | Current ATR = [(Prior ATR x 13) + Current TR] / 14 | Described as a moving average of true range; the formula is not restated |
| Originator | Wilder, New Concepts in Technical Trading Systems (1978) | Welles Wilder, in the book named in the help page |
| Direction and interpretation | States that ATR does not indicate price direction, only volatility | Links high ATR values to market bottoms and to a higher probability of a trend change; this guide does not treat that as a signal |
Where a reference is silent, this guide does not fill the gap. Check your platform for its own settings.
Some channel indicators use ATR or a range measure to set a band around price. The Donchian and Keltner channel comparison shows how a Keltner channel uses an ATR-based width, while a Donchian channel uses the highest high and lowest low.
This guide explains average true range in general and does not describe an RTX5 feature. No RTX5 release record confirms which indicators, chart types or alerts the product includes. Its Windows desktop client is in preview, and the web and mobile clients are planned. A Google Play listing for Android is published, but the mobile client has no approved release record yet; check the product-availability record before relying on any RTX5 feature.
Check RTX5 product availabilityTrust and methodology
We want you to be able to identify who owns the page, inspect the evidence, understand how tools were used, and challenge anything that looks wrong or out of date.
Published under the RTX5 Editorial Team byline. It identifies the responsible publishing organization; it does not imply that a named lawyer, regulator, financial adviser, or licensed expert approved this page.
3 primary references are listed on this page with context about what each one supports. The source set was checked on .
Automation and AI may help organize research, outline a page, or edit language. They are not treated as sources, are not presented as human experts, and do not remove the publisher's responsibility for the final page.
If a statement is incomplete, unsupported, or outdated, send the exact URL, sentence, and supporting evidence through our contact route. Read the full editorial and corrections policy.
Sources were checked on 10 November 2026. They explain market rules and concepts; they do not certify RTX5 or provide individual financial advice.
It tells you how much price has moved per bar on average, in the same units as the chart. True range includes the gap from the prior close, so it captures movement that a simple high-low range can miss. It measures volatility only. It does not give the direction of the next move or show whether a trade will work.
No. ATR does not indicate price direction, according to the StockCharts ChartSchool definition. A rising ATR shows bar ranges growing and a falling ATR shows them shrinking, and neither reading says whether price will go up or down. This guide does not present ATR as a signal.
StockCharts ChartSchool says 14 periods is the default in SharpCharts. The same page says Wilder often used an 8-period ATR, so 14 is a platform default rather than Wilder's period. Shorter periods react faster to recent bars and longer periods are smoother. Choose the period on your platform and state it when you compare results.
Choose a multiple, such as 2, and multiply it by the current ATR value. Subtract the result from the entry price for a long trade, or add it for a short. The multiple is your own choice, not a value from the indicator, and the 2 x used here is an example value with no source among the references. The example uses an assumed ATR of 2.00, so the stop sits 4.00 below a 103.50 entry, at 99.50.
No. An ATR-based stop works like any other stop loss. Once price reaches it, the order can fill at a worse price, particularly after a gap or in a fast market, so the stop distance is a calculation, not a promise.
This guide does not describe an RTX5 feature. No RTX5 release record confirms which indicators the product includes, and its Windows desktop client is in preview while the web and mobile clients are planned. A Google Play listing for Android is published, but the mobile client has no approved release record yet. Check the product-availability record before relying on any RTX5 feature.