Accountable publisher
Published under the RTX5 Editorial Team byline. It identifies the responsible publishing organization; it does not imply that a named lawyer, regulator, financial adviser, or licensed expert approved this page.
Chart indicators
A Donchian channel plots the highest high and the lowest low over a set number of bars, with a 20-bar default in StockCharts. A Keltner channel sets bands a multiple of the average true range away from a moving average. A moving average envelope sets bands a fixed percentage away from a moving average. All three describe past prices.
In brief
Three band indicators look alike on a chart but measure different things. Here is how a Donchian channel, a Keltner channel and a moving average envelope are built, and where the defaults differ.
StockCharts attributes the Donchian channel, also called a price channel, to Richard Donchian. Its upper line is the highest high over the lookback period, and its lower line is the lowest low over the same period. The StockCharts default is 20 periods, and it sets the centre line at the average of the two extremes: (20-period high + 20-period low) / 2.
Because the bands are the extremes of the window, a Donchian channel widens when recent bars include a large high or low and narrows when the recent range is small. It does not average price. The StockCharts formula does not include the most recent period, so a new extreme enters the band from the following bar. Traders often use it to see where price sits within its recent range. For a related view of range edges, see support and resistance.
A modern Keltner channel has three parts: a centre line, an ATR-based width and a multiplier. The StockCharts version uses a 20-period exponential moving average as the centre line, then adds and subtracts 2 times the 10-period average true range. The average true range guide explains that ATR measures volatility, and the exponential moving average guide covers the centre line.
The original method is older. StockCharts describes Chester Keltner's version as a 10-day simple moving average of typical price, with the 10-day simple moving average of the high-low range added and subtracted to form the bands. TradingView's support page says the basic idea was introduced by Chester Keltner in his 1960 book, and it credits Linda Bradford Raschke with the EMA centre line and ATR bands.
A moving average envelope is the simplest of the three. It takes a moving average, either simple or exponential, and sets an upper and a lower line at a fixed percentage from it. StockCharts describes the envelope as percentage-based, with the example using a 20-day simple moving average and a 2.5% envelope. Its formulas are the average plus or minus the average multiplied by 0.025.
The width is a percentage of the average, so it does not change with volatility unless the average itself moves. A wider market move does not widen the envelope by itself.
The table compares the three bands on the points that most often confuse readers. It uses the most common published construction for each, and it states where a source differs in the variant table below.
| Feature | Donchian channel | Keltner channel | Moving average envelope |
|---|---|---|---|
| Centre line | Average of the highest high and lowest low (StockCharts) | Usually a 20-period EMA | A simple or exponential moving average |
| Width basis | The highest high and lowest low over the lookback | A multiple of the ATR | A fixed percentage of the moving average |
| What the width reacts to | The range of the recent extremes | Average true range, so volatility | The average price only; it does not measure volatility |
| Typical reading | Price at the top or bottom of its recent range | Price relative to a volatility-scaled band | Price relative to a fixed percentage from the average |
| Main limit | Lags, since it uses only past bars; a single extreme can move a band sharply | Depends on the ATR length and multiplier chosen | Percentage needs re-setting across assets with very different volatility |
Sources: StockCharts ChartSchool Price Channels, Keltner Channels and Moving Average Envelopes pages, and the TradingView support page for Keltner Channels (KC). The comparison is a summary of those published constructions, not a claim about any platform's settings.
Defaults are where the sources disagree, so check the platform you use. The table lists what each cited reference states. Where a source gives no default, the cell says so instead of filling it in.
| Indicator and source | Centre line | Width | Stated default |
|---|---|---|---|
| Donchian (StockCharts Price Channels) | (High + low) / 2 over the period | Highest high and lowest low | 20 periods |
| Keltner, modern (StockCharts) | 20-period EMA | 2 x ATR(10) | EMA 20, ATR 10, multiplier 2.0 |
| Keltner (TradingView support) | Basis from the Length input, EMA optional | Multiplier x ATR | Length 20; multiplier and ATR length not stated on the cited page |
| Keltner, original (StockCharts description) | 10-day SMA of typical price | 10-day SMA of the high-low range, added and subtracted | 10 days |
| Envelopes (StockCharts) | Simple or exponential moving average | Fixed percentage of the average | SharpCharts parameters 20 and 2.5% |
| Envelopes (MetaTrader 5 help) | Simple moving average of close, period N | Shift of K / 1000 from the average, labelled basis points | Default not stated on the cited page |
The StockCharts Keltner page and the TradingView support page agree on a 20-period centre line and a multiplier of 2 in the examples. TradingView's support page does not state an ATR length, so treat ATR length as a setting to check, not a fixed rule.
Two further points need care. The MetaTrader 5 help page defines the envelope shift as K / 1000 and labels it basis points. K / 1000 is a fraction (K = 25 gives 2.5%), so the label does not match the scale. One StockCharts paragraph also describes envelope bands as 2.5 standard deviations from the average, a different construction from the percentage bands. Confirm the units and the formula in your own platform's settings before you compare two charts.
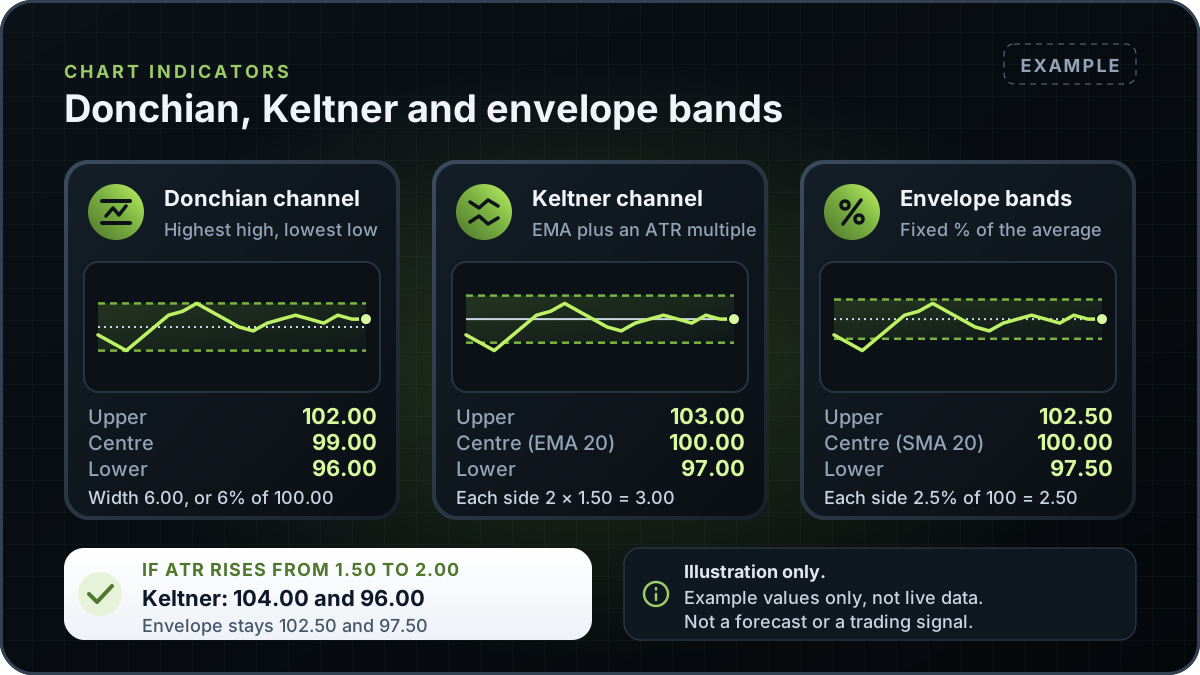
This is an Example with round numbers, not a real instrument or a forecast. Assume a series where the 20-bar high is 102.00, the 20-bar low is 96.00, the 20-period EMA is 100.00, the 10-period ATR is 1.50, and the 20-period simple moving average is also 100.00.
Donchian channel: upper line 102.00, lower line 96.00, centre line (102.00 + 96.00) / 2 = 99.00. The width is 6.00, which is 6% of the 100.00 price level. Example only.
Keltner channel (EMA 20, ATR 10, multiplier 2): upper line 100.00 + (2 x 1.50) = 103.00; lower line 100.00 - (2 x 1.50) = 97.00. The band is 3.00 either side of the centre line. Example only.
Moving average envelope (SMA 20, 2.5%): upper line 100.00 + (100.00 x 0.025) = 102.50; lower line 100.00 - 2.50 = 97.50. The band is 2.50 either side of the average. Example only.
Now suppose the 10-period ATR rises from 1.50 to 2.00 while the EMA stays at 100.00. The Keltner upper line moves to 104.00 and the lower to 96.00, a band of 4.00 either side. The envelope stays at 102.50 and 97.50, because it is a fixed percentage of the average. The Donchian channel changes only if the 20-bar extremes change.
None of the three bands measures probability. A touch of a band is a fact about the chart at that bar. For another channel type, see the linear regression channel.
This guide explains Donchian channels, Keltner channels and moving average envelopes in general and does not describe an RTX5 feature. No RTX5 release record confirms which indicators, chart types or alerts the product includes. Its Windows desktop client is in preview, and the web and mobile clients are planned. A Google Play listing for Android is published, but the mobile client has no approved release record yet; check the product-availability record before relying on any RTX5 feature.
Check RTX5 product availabilityTrust and methodology
We want you to be able to identify who owns the page, inspect the evidence, understand how tools were used, and challenge anything that looks wrong or out of date.
Published under the RTX5 Editorial Team byline. It identifies the responsible publishing organization; it does not imply that a named lawyer, regulator, financial adviser, or licensed expert approved this page.
6 primary references are listed on this page with context about what each one supports. The source set was checked on .
Automation and AI may help organize research, outline a page, or edit language. They are not treated as sources, are not presented as human experts, and do not remove the publisher's responsibility for the final page.
If a statement is incomplete, unsupported, or outdated, send the exact URL, sentence, and supporting evidence through our contact route. Read the full editorial and corrections policy.
Sources were checked on 10 November 2026. They explain market rules and concepts; they do not certify RTX5 or provide individual financial advice.
A Donchian channel uses the highest high and lowest low over a lookback period, so its width comes from the recent range of extremes. A Keltner channel sits a multiple of the average true range above and below a moving average, so its width reacts to volatility. The Donchian centre line is the midpoint of the two extremes, while the Keltner centre line is usually an exponential moving average.
StockCharts gives a 20-period exponential moving average centre line, an ATR period of 10 and a multiplier of 2.0. The TradingView support page gives a length of 20 but does not state the ATR length or multiplier defaults. Check the settings dialog of the platform you use, because the defaults differ between sources and products.
No. An envelope sits a fixed percentage above and below a moving average, so its width depends only on the average price. A Keltner channel sits a multiple of the average true range from its centre line, so its width changes with volatility. Both are centred on a moving average, which is why they can look similar on a chart.
No. These bands are calculated from past prices, and a touch shows only where price sits relative to the band on that bar. A touch can be followed by a continuation, a reversal or a range. The indicator does not measure the probability of either outcome, so it should be combined with a plan for position size, exit and risk.