Accountable publisher
Published under the RTX5 Editorial Team byline. It identifies the responsible publishing organization; it does not imply that a named lawyer, regulator, financial adviser, or licensed expert approved this page.
Technical analysis
A linear regression channel is a straight least-squares line fitted to a window of closing prices, with two parallel bands set a chosen number of standard deviations above and below it. The line is recalculated as the window moves, so the channel describes past prices only.
In brief
A linear regression channel is a fitted line with bands on either side. Here are the least-squares formulas, a five-bar worked example, and why platforms draw different channels from the same closes.
A linear regression channel starts with a window of recent closing prices. Each bar in the window gets a bar number, x, and its close is y. A least-squares straight line is fitted through those points. The fitted line is the centre of the channel, and its slope shows the direction of the window's trend.
Each close sits some distance from the line. That distance is a residual. The residual standard deviation summarises the residuals, and each band sits a chosen number of residual standard deviations above and below the fitted line. For lines drawn by hand instead, see how to draw trendlines.
The NIST/SEMATECH e-Handbook of Statistical Methods describes least-squares estimation as minimising the sum of the squared deviations between the data and the model. For a straight line, that principle gives the formulas below.
The formulas follow the NIST/SEMATECH e-Handbook for a straight line, y = b0 + b1 x, fitted to n observations.
TradingView's help article on its Regression Trend tool describes bands set a user-defined number of standard deviations from a base line, with separate upper and lower deviation inputs. It does not state default values. The choice of k is a setting, not a rule.
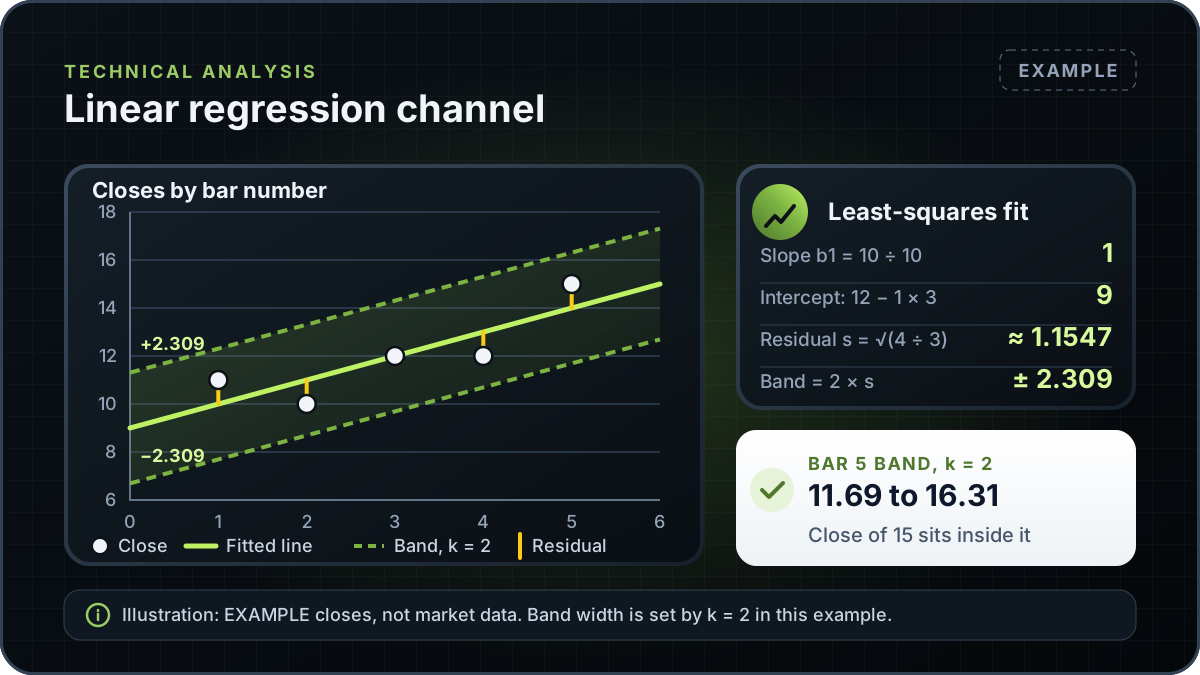
This is an Example with made-up numbers, not market data. Five closes sit at bars 1 to 5: 11, 10, 12, 12 and 15. The mean bar number is 3 and the mean close is 12.
| Bar (x) | Close (y) | x minus 3 | y minus 12 | Product | Fitted value | Residual | Residual squared |
|---|---|---|---|---|---|---|---|
| 1 | 11 | -2 | -1 | 2 | 10 | 1 | 1 |
| 2 | 10 | -1 | -2 | 2 | 11 | -1 | 1 |
| 3 | 12 | 0 | 0 | 0 | 12 | 0 | 0 |
| 4 | 12 | 1 | 0 | 0 | 13 | -1 | 1 |
| 5 | 15 | 2 | 3 | 6 | 14 | 1 | 1 |
| Sum | 60 | 0 | 0 | 10 | 60 | 0 | 4 |
Example arithmetic. Mean x = 3 and mean y = 12. The values are a teaching case, not a recommended setting.
Slope. The products add to 10, and the squared x deviations also add to 10. So b1 = 10 divided by 10 = 1. The fitted line rises by 1 close for each bar.
Intercept. b0 = 12 minus (1 times 3) = 9. The fitted line is 9 plus x, with fitted values of 10, 11, 12, 13 and 14.
Residual standard deviation. The residuals are 1, -1, 0, -1 and 1. Their squares add to 4, and they sum to zero. With n minus 2 = 3, s = the square root of (4 divided by 3), about 1.1547.
Band at k = 2. The half-width is 2 times the square root of (4 divided by 3), which is 2.3094 to four decimal places, so it rounds to 2.309. At bar 5 the fitted value is 14, so the band runs from 11.69 to 16.31, and the close of 15 sits inside it. The multiplier of 2 is a choice for this example, not a recommended value.
Channel names, defaults and inputs are not standard. The same closes can produce different bands on two platforms, because the window, the multiplier and the divisor in the spread can each change. For example, the NIST-based formula on this page divides by n minus 2 (n minus p, with p = 2 for a straight line), while StockCharts' Standard Deviation indicator, a separate volatility measure, is calculated for a population.
| Item | Variant one | Variant two | What to check |
|---|---|---|---|
| Divisor for the spread | n minus p in NIST's handbook, where p is the number of parameters. For a straight line p = 2, so n minus 2 (used here) | Not named in the TradingView article checked. Check each platform's documented formula | A different divisor gives different band widths from the same closes. |
| Default length | No default is stated in the TradingView article checked | StockCharts' Slope indicator uses 20 periods by default. It is a separate calculation, not a channel default | Read the settings dialog of the platform you use. |
| Deviation multiplier | TradingView's Regression Trend tool has separate Upper and Lower Deviation inputs | This page uses k = 2 only as a worked choice, not a default | Upper and lower multipliers can differ, so check both. |
| Spread basis | Residuals of the closes from the fitted line (NIST, used here) | TradingView's Regression Trend article sets bands a user-defined number of standard deviations from a base line, and does not say how that base line is computed | Read the platform's help or script source before comparing tools. |
Sources: StockCharts ChartSchool pages on Standard Deviation and Slope, the TradingView Regression Trend help article, and the NIST/SEMATECH e-Handbook. The StockCharts pages describe related indicators. The Slope page mentions the Raff Regression Channel, an annotation tool with a regression line in the middle and equidistant outer lines, but gives no formula for it.
StockCharts' Standard Deviation indicator is a separate volatility measure, not a channel, so this guide does not use it.
Before you compare two charts, match the length, the multiplier and the divisor. For a channel built from highs and lows rather than a fit, see Donchian and Keltner channels.
A rolling linear regression channel uses the last N closes. When a new bar closes, the window shifts, the fit is run again, and the bands move with it. A channel drawn earlier can look different once more bars arrive.
Before you use a platform's channel to review past charts, check how it refits the line, and whether a past bar changes when new bars arrive.
A channel drawn with fixed anchor points does not refit this way. Support and resistance covers price levels, which follow no fitted arithmetic.
A band describes distance. A close near the upper band sits far above the fitted line, measured in units of the window's residual spread. It does not say whether price will continue, reverse or stall.
This guide explains linear regression channels in general and does not describe an RTX5 feature. No RTX5 release record confirms which indicators, chart types or alerts the product includes. Its Windows desktop client is in preview, and the web and mobile clients are planned. A Google Play listing for Android is published, but the mobile client has no approved release record yet; check the product-availability record before relying on any RTX5 feature.
Check RTX5 product availabilityTrust and methodology
We want you to be able to identify who owns the page, inspect the evidence, understand how tools were used, and challenge anything that looks wrong or out of date.
Published under the RTX5 Editorial Team byline. It identifies the responsible publishing organization; it does not imply that a named lawyer, regulator, financial adviser, or licensed expert approved this page.
6 primary references are listed on this page with context about what each one supports. The source set was checked on .
Automation and AI may help organize research, outline a page, or edit language. They are not treated as sources, are not presented as human experts, and do not remove the publisher's responsibility for the final page.
If a statement is incomplete, unsupported, or outdated, send the exact URL, sentence, and supporting evidence through our contact route. Read the full editorial and corrections policy.
Sources were checked on 10 November 2026. They explain market rules and concepts; they do not certify RTX5 or provide individual financial advice.
Platforms use the names differently, so check each tool's formula. Here, a linear regression channel is a least-squares line with bands at k times the residual standard deviation. Read the help page before comparing them.
No single length is standard. StockCharts' Slope indicator uses 20 periods by default, but that is a different calculation. A short window reacts to noise, while a long one lags turns. Pick a length, record it, and keep it the same across charts before you compare results.
No. The channel describes the closes in a past window and is recalculated as new bars arrive. It does not forecast price, and a close touching a band is not a signal by itself. Use it to describe how far recent closes sit from a fitted line.
It is the typical distance of the closes from the fitted line. NIST's handbook divides the sum of the squared residuals by n minus p, the number of parameters, then takes the square root. For a straight line p = 2, so this guide uses n minus 2. A residual is a close minus its fitted value.
The window length, the deviation multiplier, the divisor in the spread and the way the platform refits the line can all differ. The same five closes can therefore produce two sets of bands. Compare the inputs first, and read the platform's help page for the exact formula.
A band is a reference for distance from the fitted line, not a broker instruction. Where a stop goes depends on your plan, the order type and how your broker triggers stops, and a stop can fill away from its trigger in fast markets. Read the stop-loss guide before you place an order.