Accountable publisher
Published under the RTX5 Editorial Team byline. It identifies the responsible publishing organization; it does not imply that a named lawyer, regulator, financial adviser, or licensed expert approved this page.
Chart reading
How to draw trendlines means connecting at least two swing lows in an uptrend or two swing highs in a downtrend, then checking that the line is touched again. A trendline describes the direction of price. It does not predict where price will go next.
In brief
A step-by-step method for choosing anchor points, confirming a line and avoiding the mistakes that make a trendline look more useful than it is.
A trendline is a straight line drawn along a series of swing points. It is a chart-reading convention used to describe the direction of recent price action and where the market has stopped or reversed before. The method below works the same way on a daily or an intraday chart.
For how charts fit into a trading routine, read what is trading.
Pick the timeframe that matches the decision you are making: a daily chart for a multi-day view, a one-hour chart for an intraday view. A common practice is to draw on the timeframe you will act on and check the higher timeframe too, because a line on a short chart can contradict the larger trend.
The ASX introductory course on technical analysis defines an uptrend as higher highs and higher lows, and a downtrend as lower highs and lower lows. When neither holds, it describes the market as trading sideways. Do not force a line onto an unclear chart; the absence of a trend is also a useful reading.
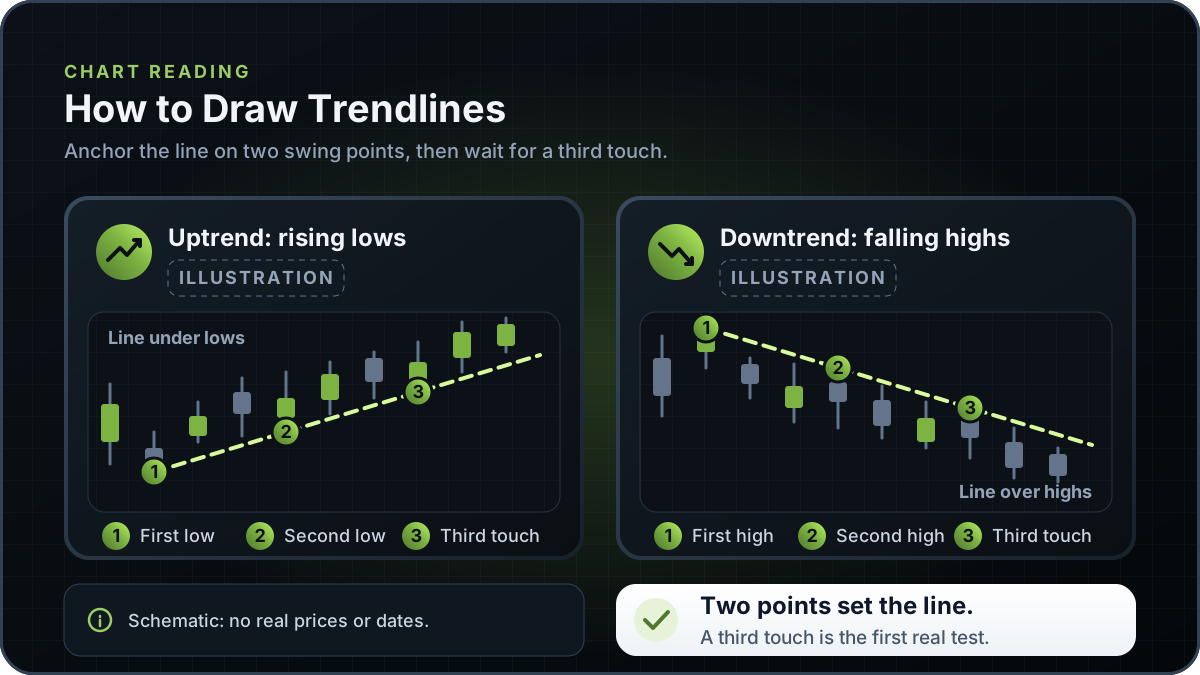
In an uptrend, connect at least two swing lows that rise from left to right. In a downtrend, connect at least two swing highs that fall from left to right. The first two points set the slope, so choose the swings you would point to on a printed chart, not minor bars in the middle of a move.
Decide whether your anchors use the extreme of the wick or the body of each candle, meaning the open or close. Use the same rule for every line on the chart. If you switch rules, the lines stop being comparable and the touch test changes.
Extend the line to the right. Two points are enough to draw any straight line, so they cannot show on their own whether price respects it. A common chart-reading convention treats a third point where price touches and respects the line as the first real test. This is a drawing convention, not a tested rule. Until then, a two-point line is a hypothesis to watch.
Scroll back and check how earlier price action sits against the line. If you have to tilt the line to catch a spike, or move an anchor until it fits, the trend may not be clean enough for a line. When the highs or lows do not line up without forcing, leave the chart without a line.
A common practice is to treat a close through the line as a warning to re-check the chart, not as a final verdict on the trend. A break can be a short-term move that reverses. Re-check the anchors and the higher timeframe, and redraw from new swing points if the market has built a new structure. Do not keep moving the old line to save it.
An arithmetic (linear) scale shows equal price distances as equal vertical distances. A semi-log scale shows equal percentage moves as equal vertical distances. Example: a rise from 10 to 20 is 100% and a rise from 100 to 110 is 10%; both are 10 units on a linear scale, but the first looks much larger on a semi-log scale. Over a large price change, a straight line on one scale becomes a curve on the other, so state which scale you used.
The diagram at the top of this page has two schematic panels. On the left, an uptrend line rises under three numbered swing lows as a sloped support line. On the right, a downtrend line falls over three numbered swing highs as a sloped resistance line.
The panels show the anchor logic only, with no real prices, tickers or dates. For horizontal price levels that the same kind of chart reading uses, see support and resistance. For the pattern side of chart reading, see bullish chart patterns.
In the ASX course, the rectangle between the open and the close is the body, or real body, and the single lines above or below it are called shadows, wicks or tails. Candlesticks use the same open, high, low and close data as a bar chart, so the wick ends sit at the high and low. A line anchored to wick extremes sits at a different level from a line anchored to bodies. Neither choice is inherently correct, but it changes which touches count. If you decide to ignore an occasional spike, record that too, because it is a further judgement.
Write the rule down before you draw, and keep it for every chart you compare. A line that switches from wicks to bodies between anchors is hard to test, because the third touch can be judged differently under each rule.
Most weak trendlines come from a small number of avoidable errors. The table lists common ones. It describes drawing practice, not a tested result.
| Error | What it looks like | Why it matters | Fix |
|---|---|---|---|
| Too few touches | A line through two points with no later test | Two points define the line, but only a further touch shows whether price respects it | Wait for a third touch, or label the line as tentative |
| Forcing the line | The line is tilted to pass through spikes or gaps | The line then describes the fit you chose, not the market | Redraw from the clearest swing points, or drop the line |
| Wrong anchor points | Anchors on minor, noisy bars inside a move | Anchors set the slope, so a poor anchor shifts every later test | Use the swings you would mark on a printed chart |
| Mixing wicks and bodies | Some anchors use wicks and others use closing prices | Lines cannot be compared, and the touch test changes from line to line | Choose one rule and apply it to every line |
| Ignoring the higher timeframe | A short-chart line runs against the larger trend | Short-term noise can dominate the reading | Check the higher timeframe before you act on the line |
| Treating a break as a signal | Acting on a single close through the line | A break can be a short-term move that reverses | Re-check the anchors and wait for other evidence |
The table describes common chart-reading practice. It does not show a tested result.
A trendline summarises where recent swing points sit. It can show that price has been making higher lows or lower highs. It does not show future direction, or how far a move will travel after a touch or a break. Drawing is also a judgement: in a working paper on automated chart-pattern recognition, Lo, Mamaysky and Wang describe the highly subjective nature of technical analysis, where shapes on price charts are "often in the eyes of the beholder". The ASX course makes a related point: charts cannot predict the future with any certainty.
A line carries no information about position size, costs or the outcome of a trade. A trader who uses trendlines still needs a plan for an adverse move, such as a stop loss order placed at a level the trader has chosen for their own reasons.
RTX5 is Orrnn's trading terminal and broker-technology product. Its Windows desktop client is in preview, and the web and mobile clients are planned. A Google Play listing for Android is published, but the mobile client has no approved release record yet; check the product-availability record before relying on any RTX5 feature. The diagram on this page is schematic and is not output from an RTX5 feature. The charts page describes RTX5 chart features.
Check RTX5 product availabilityTrust and methodology
We want you to be able to identify who owns the page, inspect the evidence, understand how tools were used, and challenge anything that looks wrong or out of date.
Published under the RTX5 Editorial Team byline. It identifies the responsible publishing organization; it does not imply that a named lawyer, regulator, financial adviser, or licensed expert approved this page.
3 primary references are listed on this page with context about what each one supports. The source set was checked on .
Automation and AI may help organize research, outline a page, or edit language. They are not treated as sources, are not presented as human experts, and do not remove the publisher's responsibility for the final page.
If a statement is incomplete, unsupported, or outdated, send the exact URL, sentence, and supporting evidence through our contact route. Read the full editorial and corrections policy.
Sources were checked on 9 November 2026. They explain market rules and concepts; they do not certify RTX5 or provide individual financial advice.
At least two. Two points are enough to draw any straight line, so they cannot show on their own whether price respects it. A common chart-reading convention treats a third touch that price respects as the first real test. A line with only two points is worth watching, but it is not yet evidence that the line will hold.
Either can be used, but pick one rule and apply it to every line on the chart. Wick anchors use the high or low that price reached in each period. Body anchors use the open or close. A body rule moves the line less for a single spike, but it also changes which touches count. Neither choice is a fixed rule, so note which one you used before you compare charts.
Not necessarily. A common practice is to treat a break as a warning to re-check the chart, not as a final verdict, because a break can be a short-term move that reverses. Check the anchor points, the higher timeframe and any other evidence you use before deciding the trend has changed. A break tells you to re-check the chart, not that the market will move in a particular direction.
A trendline is a sloped line drawn through swing points, while support and resistance are usually horizontal price levels. The ASX introductory course describes a resistance line drawn through the highs and a support line drawn through the lows of a range. Chart readers often apply the same touch-and-break reading to both kinds of line. The support and resistance page covers horizontal levels.
Sometimes. A semi-log scale shows equal percentage moves as equal vertical distances, while a linear scale shows equal price changes as equal distances. Over short ranges the two scales look similar. Over a large price change, a straight line on one scale becomes a curve on the other, so the same anchors can give a different-looking line. Always state which scale you used.
No. A trendline describes where recent swing points sit. It does not forecast price, and it does not prove that price will bounce or break at the line. Use it as one part of chart reading, alongside a risk plan such as a stop loss order, and re-test each line as new bars form.