Accountable publisher
Published under the RTX5 Editorial Team byline. It identifies the responsible publishing organization; it does not imply that a named lawyer, regulator, financial adviser, or licensed expert approved this page.
Chart patterns
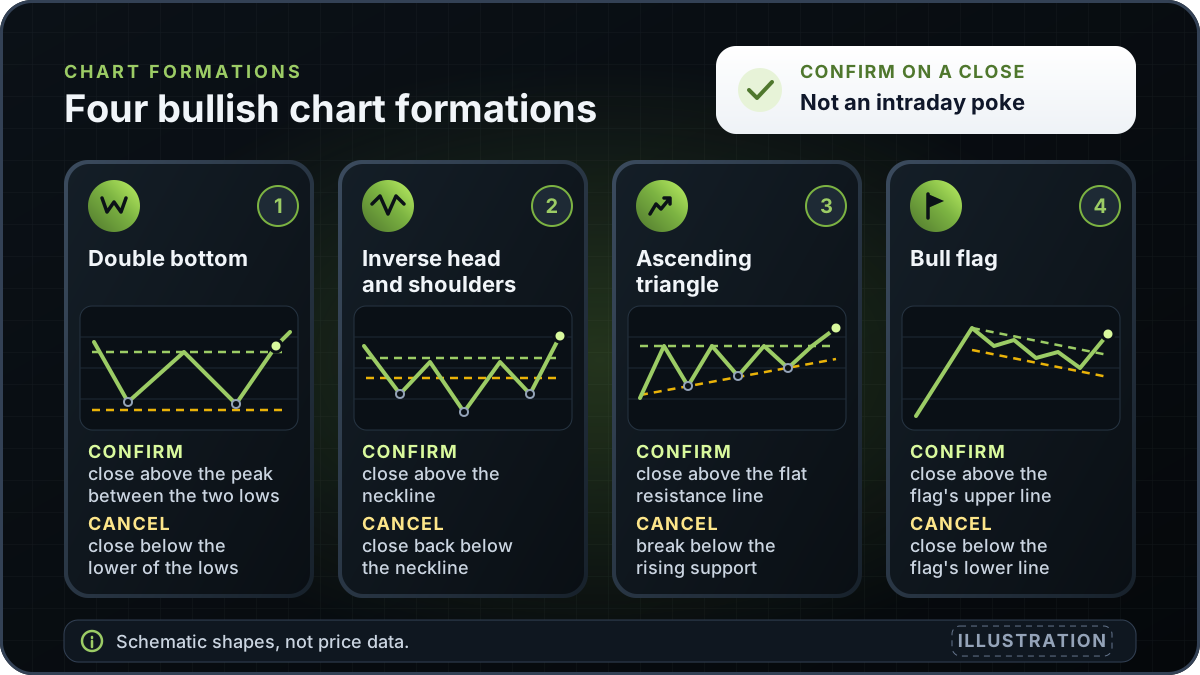
Bullish chart patterns are price formations that technical analysts read as a possible sign of a rise. Examples include the double bottom, inverse head and shoulders and bull flag. They describe a shape already on a chart. They do not forecast direction, and each one has conditions that cancel the reading.
In brief
A formation is a shape in past prices that traders read as favouring a rise. Here are seven common ones, their bearish counterparts, and the conditions that would cancel each reading.
A chart pattern is a recognisable shape that price forms over time. Bullish chart patterns are shapes that technical analysts associate with a possible upward move, usually after a decline or during an uptrend. Their names describe the picture: two lows at about the same level, a head between two shoulders, or a flat top with rising lows underneath.
The shape is the starting point, but the rules that define it are conventions. Analysts and software draw the same chart in different ways, so the same formation can have more than one reading. A paper by Lo, Mamaysky and Wang calls technical analysis highly subjective and says shapes in historical price charts are "often in the eyes of the beholder". FINRA names fundamental and technical analysis as two common methods used to analyse stocks, so a formation is one method among several. For the wider background, see price action trading. For the single-candle shapes that sit inside a formation, see candlestick patterns.
| Formation | Shape | Typical reading | What would invalidate it |
|---|---|---|---|
| Inverse head and shoulders | Three lows. The middle low (the head) is the deepest, with two shoulders at similar levels. | A possible rise if price closes above the neckline, the line joining the peaks between the lows. | Price closes back below the neckline and stays there after a breakout. |
| Double bottom | Two lows at about the same level, with a peak between them. | A possible rise if price closes above the peak between the lows (the neckline). | A close below the lower of the two lows, or a failure to hold above the neckline. |
| Ascending triangle | A flat resistance line on top, with rising lows underneath. | A breakout above the flat line, read as buyers taking control. | A close back below the flat resistance line, or a break of the rising support line. |
| Bull flag | A sharp rise (the pole), then a small downward-sloping channel (the flag). | Continuation: a breakout above the flag's upper line, read as the rise resuming. | A break below the flag's lower line, or a pullback that runs deep into the pole. |
| Cup and handle | A rounded bottom (the cup), then a small dip (the handle) before the breakout. | A possible rise when price breaks above the rim of the cup, the level of the highs either side of it. | A break below the low of the handle, or a failure soon after the breakout. |
| Falling wedge | Two downward-sloping lines that converge, with the lower line steeper. | A possible reversal up when price breaks above the upper line. | A break below the lower line, or a close back inside the wedge after the breakout. |
| Rising channel | Two parallel upward-sloping lines that contain price. | Often read as continuation of an uptrend, with bounces off the lower line read as buying. | A close below the lower line, which is read as the uptrend weakening. |
Descriptions summarise common technical-analysis conventions. Levels are read from the chart, not from a formula, and the sources below do not define each formation.
A formation that has not broken its key line is still developing. Analysts use a few common checks before they treat it as confirmed. None of them makes the pattern certain.
A breakout that reverses is a failed formation. A trade plan should allow for that before the breakout happens, not after.
Every formation has a point at which the reading is cancelled. That invalidation level is often more useful than the pattern name. A breakout trade commonly uses a stop order to exit if price returns through the level.
A stop order is an instruction, not an exit at a set price. FINRA explains that once the stop price is reached, a stop order turns into a market order and is executed at the current market price. Check how your broker handles stop orders before relying on one at the invalidation level. For how stops work, see what is a stop loss order.
Bearish chart patterns use the same logic in reverse. Checking the other side of a chart before you commit to a reading helps avoid one-sided analysis. The common counterparts are:
Most formations are built from lines: a neckline, a flat resistance level, or a trendline. The lines matter more than the label. For how those levels are identified and tested, read support and resistance and how to draw trendlines.
Two analysts can draw the same chart and place the neckline differently, so a pattern name is not a single fact. If the lines are disputed, the reading is weaker, and that is worth recording in your notes.
A formation is a description of past price. It does not show why price moved, what news is due, or how far a move will go. A clean-looking formation can still fail, and a historical example on a chart is not evidence that the pattern will work again.
Formations are not forecasts. No pattern on this page is a win rate, a price target or a recommendation. The next step is to test the lines on a chart you already follow, and to write down the level at which you would stop believing the reading.
RTX5 is Orrnn's trading terminal and broker-technology product. Its Windows desktop client is in preview, and the web and mobile clients are planned. A Google Play listing for Android is published, but the mobile client has no approved release record yet; check the product-availability record before relying on any RTX5 feature. Nothing on this page describes a chart-pattern recognition feature in RTX5.
Check RTX5 product availabilityTrust and methodology
We want you to be able to identify who owns the page, inspect the evidence, understand how tools were used, and challenge anything that looks wrong or out of date.
Published under the RTX5 Editorial Team byline. It identifies the responsible publishing organization; it does not imply that a named lawyer, regulator, financial adviser, or licensed expert approved this page.
4 primary references are listed on this page with context about what each one supports. The source set was checked on .
Automation and AI may help organize research, outline a page, or edit language. They are not treated as sources, are not presented as human experts, and do not remove the publisher's responsibility for the final page.
If a statement is incomplete, unsupported, or outdated, send the exact URL, sentence, and supporting evidence through our contact route. Read the full editorial and corrections policy.
Sources were checked on 9 November 2026. They explain market rules and concepts; they do not certify RTX5 or provide individual financial advice.
This page does not establish that they are reliable. A bullish chart pattern describes a past price shape, and it can fail after a breakout. Analysts judge a formation by its confirmation rules and its invalidation level, not by its name. Study results on how often patterns succeed vary and are not quoted here, so test any pattern on your own data before you rely on it.
A bullish chart pattern is read as a possible rise, and a bearish one as a possible fall. The two often mirror each other: an inverse head and shoulders is the counterpart of a head and shoulders top, and a double bottom mirrors a double top. The shape alone does not settle the direction, so check the lines and the breakout before drawing a conclusion.
No. A double bottom has two lows at about the same level, with a peak between them. An inverse head and shoulders has three lows, and the middle one is clearly the deepest. If the middle low is not lower than the two shoulders, the shape may be a triple bottom or simple noise. Both are usually read on a breakout above the neckline.
Many traders place a stop at the invalidation level so the trade ends if the reading is cancelled. A stop is not a guarantee of an exit at a set price, and the fill can differ from the stop level. Set the position size so that the planned loss, including a possible gap, is an amount you accept.
The shapes are the same, but the behaviour can differ. Liquidity, trading hours, volatility and the way a broker triggers stops vary between shares, forex, indices and commodities. Check the instrument and the session before you read a formation, and apply the same conventions to every chart you compare.
No. This page is educational. It describes formations and common conventions, and it does not tell you whether to buy, sell or hold any instrument. For advice that fits your circumstances, speak to a licensed adviser in your jurisdiction.