Accountable publisher
Published under the RTX5 Editorial Team byline. It identifies the responsible publishing organization; it does not imply that a named lawyer, regulator, financial adviser, or licensed expert approved this page.
Technical analysis
Price action trading is a method of analysing a market by reading its price movement directly, using candles, swing highs and lows, support and resistance levels, and trend structure. It describes what price has done rather than predicting what it will do. It does not prove an edge on its own, and its signals are open to interpretation.
In brief
Price action trading is about describing the price record, not predicting it. Here is what it reads, what it ignores, and why its results need testing before anyone relies on them.
Price action trading starts from the price record. A trader looks at candles, swing highs and lows, levels where price has stalled or reversed, and the way those points line up into a trend. The chart is the main evidence, and less weight goes to company accounts, economic data or news unless their effect shows up in price.
The CMT Association describes technical analysis as a methodology that evaluates markets by analysing statistical patterns in market data, including price movement, volume and momentum. Price action is a narrower part of that field, because it focuses on raw price. For background on the wider subject, read what is trading.
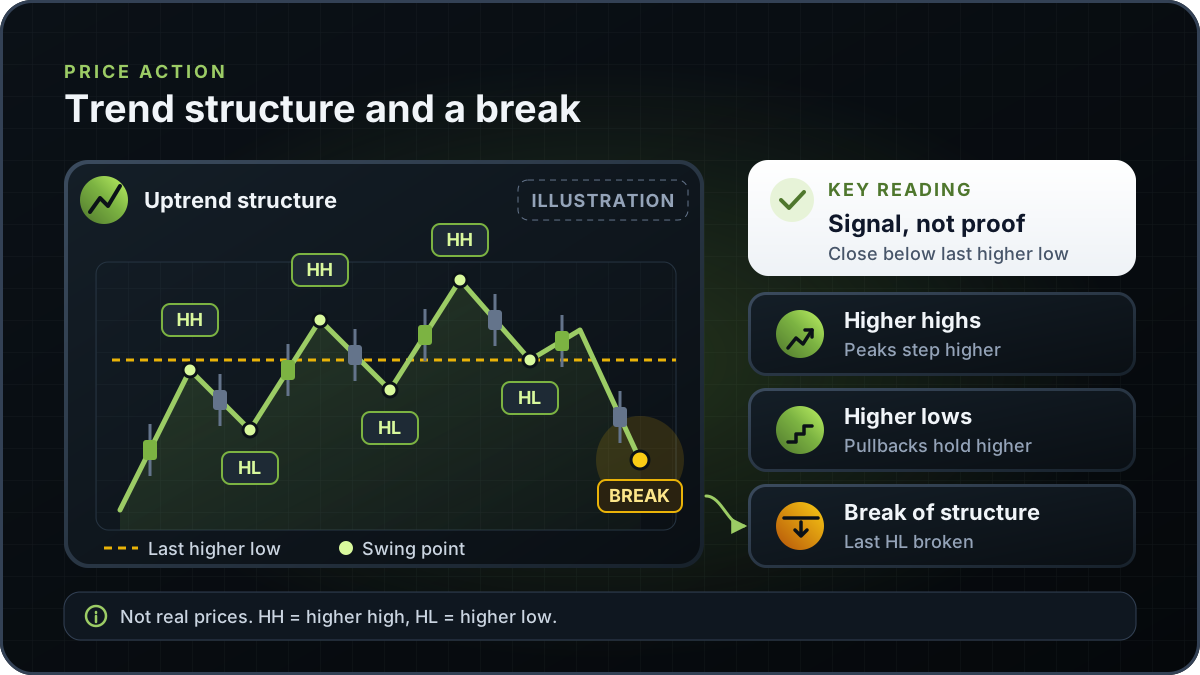
A common way to describe an uptrend is a series of higher highs, where each peak sits above the one before, and higher lows, where each pullback holds above the last low. A downtrend is the mirror image. The structure is a description of recent behaviour. It says nothing firm about how long the trend will last.
A break of structure is a move that takes out a swing point defining the current trend. In a simple uptrend, a close below the most recent higher low is often treated as the sign that the structure has changed. The trader then has to decide whether the change is real, a brief sweep through the low, or a pullback that will recover. The illustration shows this with a schematic path, not real prices.
The drawback is timing. A swing point is confirmed only after price has moved away from it, so the signal usually arrives after a turn has begun. That is one reason price action readings look clearer on a finished chart than they did while the chart was forming.
The table sets out the usual division. It describes how the method is typically taught, not a set of rules, and many traders add other tools to it.
| Area | What price action reads | What price action ignores |
|---|---|---|
| Candles | Open, high, low and close for each period, and the shape of the body and wicks | Why a candle formed, such as the company announcement or data release behind it |
| Swing points | Local highs and lows and the order in which they form | The fundamental value that might justify a move |
| Levels | Prices where price has stalled, reversed or broken before | Any claim that a level must hold or that it is exact |
| Trend structure | Higher highs and higher lows, or lower highs and lower lows | How long the structure will last, or what will break it |
| Volume and momentum | Only where they are shown alongside the price move or added on purpose | Unless a trader adds them; price action on its own leaves them out |
| News and economic data | Only the price reaction to them | The content of the release and its likely effect on earnings or policy |
A descriptive split, not a regulatory definition. Check how any method you study defines its inputs before comparing results.
Two traders can mark the same chart differently. They may use different timeframes, define swings in different ways, or draw a support zone at different heights. Each choice changes which pattern appears. This is why price action is hard to test unless the rules are fixed first.
FINRA's investor education on momentum investing, a strategy it says typically focuses primarily on technical analysis, says momentum indicators can give false signals in volatile markets and are not assured. The same caution applies to price action readings, which come from the same kind of chart evidence. FINRA also notes that figuring out when a stock is nearing a peak or trough is a big challenge.
Treat any price action signal as a hypothesis. Write the rules down, test them over a sample with costs included, and record the results whether they help or not.
Each building block has its own guide. Candles, levels and trendlines are covered by the pages linked above, and volume in trading covers the volume context that many traders add.
RTX5 is Orrnn's trading terminal and broker-technology product. Its Windows desktop client is in preview, and the web and mobile clients are planned. A Google Play listing for Android is published, but the mobile client has no approved release record yet; check the product-availability record before relying on any RTX5 feature. The chart examples on this page are illustrative and do not describe a specific RTX5 feature.
Check RTX5 product availabilityTrust and methodology
We want you to be able to identify who owns the page, inspect the evidence, understand how tools were used, and challenge anything that looks wrong or out of date.
Published under the RTX5 Editorial Team byline. It identifies the responsible publishing organization; it does not imply that a named lawyer, regulator, financial adviser, or licensed expert approved this page.
4 primary references are listed on this page with context about what each one supports. The source set was checked on .
Automation and AI may help organize research, outline a page, or edit language. They are not treated as sources, are not presented as human experts, and do not remove the publisher's responsibility for the final page.
If a statement is incomplete, unsupported, or outdated, send the exact URL, sentence, and supporting evidence through our contact route. Read the full editorial and corrections policy.
Sources were checked on 9 November 2026. They explain market rules and concepts; they do not certify RTX5 or provide individual financial advice.
Price action trading is a way of reading a chart from the price record itself. Traders look at candles, swing highs and lows, levels and trend structure to describe what the market is doing. It is descriptive. A reading of price shows what has happened, and it does not tell you what will happen next.
Not exactly. Technical analysis is the wider field. The CMT Association describes it as analysing statistical patterns in market data, including price movement, volume and momentum. Price action focuses on raw price and often uses little else. Many traders combine the two, so check which inputs a method uses before you compare results.
There is no proven, repeatable edge that is accepted across markets. A 2000 study of US stocks from 1962 to 1996 found that several technical indicators provided incremental information and may have some practical value. That is not the same as a reliable profit method. Results depend on the rules, the period, the market and costs, so test any method with fixed rules before you rely on it.
No. Candlestick shapes are one part of price action. A trader can read swing points, levels and trend structure from closing prices alone. Many people use candles because each one shows the open, high, low and close for its period. The candlestick patterns page explains the common shapes and why they do not predict the next move on their own.
A break of structure is a price move that takes out a swing point defining the current trend. In an uptrend, a close below the latest higher low is a common example. It is a convention for describing a change in trend structure. It does not prove the trend has reversed, because price can recover, and the break can come after the turn has already started.
It can be learned as a way of describing charts, but using it to make decisions is harder than the diagrams suggest. Beginners often see patterns more clearly after the fact. Write down each reading before the outcome is known, review the record honestly, and understand the risks of leverage before you trade any instrument.