Accountable publisher
Published under the RTX5 Editorial Team byline. It identifies the responsible publishing organization; it does not imply that a named lawyer, regulator, financial adviser, or licensed expert approved this page.
Technical indicators
The fractals indicator, based on Bill Williams' five-bar rule, marks a swing high when the middle bar of five has the highest high of the set, and a swing low when the middle bar has the lowest low. Each fractal is confirmed only after two more bars have formed, so it is a description of past price.
In brief
A fractal is a description of past price, not a signal. Here is the five-bar rule, a worked EXAMPLE of an up and a down fractal, and why each one is known only after two later bars.
The fractals indicator marks local turning points on a price chart. The TradingView support article on Williams fractals credits Bill Williams and his 1995 book Trading Chaos.
A fractal is a pattern of five bars, not a single bar. Its middle bar is the extreme of the set. An up fractal marks a swing high and a down fractal marks a swing low. For the basics of trading itself, start with what is trading.
Read the rule from the middle bar outward. In an up fractal, the middle bar's high must be the highest of the five, and each of the two bars on either side must have a lower high. In a down fractal, the middle bar's low must be the lowest, and each of the two bars on either side must have a higher low.
| Element | Up fractal (swing high) | Down fractal (swing low) |
|---|---|---|
| Bars in the set | Five by default (TradingView); MetaTrader 5 says at least five | Five by default (TradingView); MetaTrader 5 says at least five |
| Middle bar | Has the highest high of the five | Has the lowest low of the five |
| Two bars on the left | Each has a lower high than the middle bar | Each has a higher low than the middle bar |
| Two bars on the right | Each has a lower high than the middle bar | Each has a higher low than the middle bar |
| When it is known | By the rule, after the second bar to the right closes | By the rule, after the second bar to the right closes |
Sources: MetaTrader 5 help, Fractals (Bill Williams' Indicators), which says at least five successive bars, and TradingView support, Williams fractal indicator, which uses five candlesticks by default. Both describe the middle-bar extreme. The timing row follows from the rule itself; TradingView describes the lag as two or more candlesticks, give or take. Verified on 10 November 2026.
Neither cited source says what happens when a bar beside the middle bar has the same high or low. Read literally, both require 'lower' or 'higher', which would exclude a tie. Check how your platform handles equal values before you compare its marks with another chart.
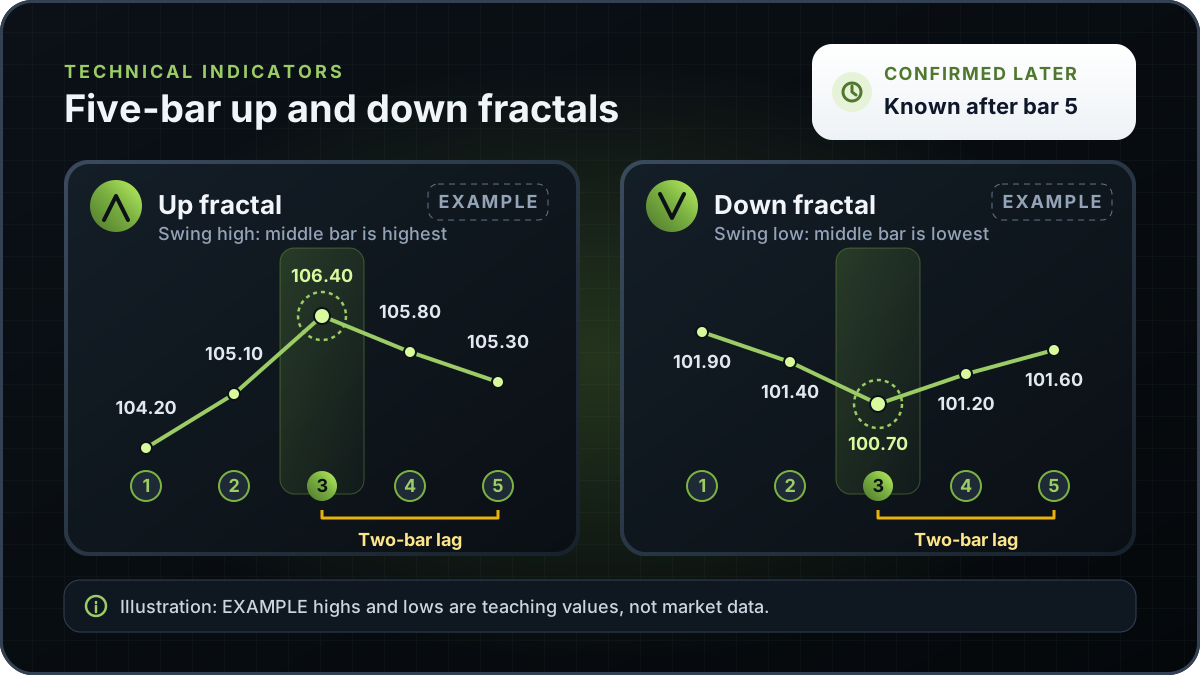
This EXAMPLE uses made-up values, not market data. Five consecutive bars are numbered 1 to 5 from left to right, and only their highs are used.
| Bar | High | Position | Check against the middle bar |
|---|---|---|---|
| 1 | 104.20 | Left side | Lower than 106.40 |
| 2 | 105.10 | Left side, nearest | Lower by 1.30 (106.40 minus 105.10) |
| 3 | 106.40 | Middle bar | Highest of the five |
| 4 | 105.80 | Right side, nearest | Lower by 0.60 (106.40 minus 105.80) |
| 5 | 105.30 | Right side | Lower than 106.40 |
EXAMPLE values only. Bar 3 is the up fractal, and it is confirmed when bar 5 closes.
Bar 3 is the up fractal because its high of 106.40 is higher than all four neighbours. The fractal is known only at the close of bar 5, the second bar to the right of the middle bar.
The mirror case uses the same five-bar layout with lows. This EXAMPLE is also made up. The middle bar is bar 3, and its low is the lowest of the set.
| Bar | Low | Position | Check against the middle bar |
|---|---|---|---|
| 1 | 101.90 | Left side | Higher than 100.70 |
| 2 | 101.40 | Left side, nearest | Higher by 0.70 (101.40 minus 100.70) |
| 3 | 100.70 | Middle bar | Lowest of the five |
| 4 | 101.20 | Right side, nearest | Higher by 0.50 (101.20 minus 100.70) |
| 5 | 101.60 | Right side | Higher than 100.70 |
EXAMPLE values only. Bar 3 is the down fractal, and it is confirmed when bar 5 closes.
A down fractal reads the same way with the inequalities reversed. Bar 3 is the swing low at 100.70, and it is known only once bar 5 has closed.
A fractal cannot be known when its middle bar prints. To check the right-hand side, the indicator needs the two bars after the middle bar. In the up fractal EXAMPLE, bar 3 prints the high at 106.40, but the pattern is complete only when bar 5 closes. That is a lag of two bars.
TradingView describes the lag as 'two or more candlesticks, give or take', and says the Williams fractal does not redraw. Because of this, the newest two bars on any chart cannot yet form a confirmed fractal. The most recent confirmed fractal always sits at least two bars behind the current bar.
A confirmed fractal gives a dated swing point. Some traders record its high or low as a reference level and watch how later price behaves around it. In the up fractal EXAMPLE, the 106.40 high is the reference. A later close above 106.40 would show that the reference high has been exceeded. It would not show what happens after that.
Some traders read fractal levels alongside support and resistance, which looks at price areas that have held or failed before. A different way to filter swings is the ZigZag indicator. The Awesome Oscillator is another Bill Williams tool, and it is a separate indicator with its own rules.
The cited references agree on the middle-bar extreme and on five candlesticks as the TradingView default. They differ on the bar count the MetaTrader 5 page states, and on what they say about settings. The table records each reference as written.
| Reference | Bars per fractal | Default | Lag and redraw |
|---|---|---|---|
| MetaTrader 5 help, Fractals | At least five successive bars, middle bar extreme (MT5 wording) | Not stated on the page | Not stated on the page |
| TradingView support, Williams fractal indicator (credits Bill Williams, Trading Chaos, 1995) | Five by default, with the count adjustable | Five candlesticks | Two or more candlesticks, give or take; no redraw |
Verified on 10 November 2026. Where a reference does not state a value, the cell says so rather than filling it in.
TradingView lets users change the total candlestick count. Neither cited source says how the confirmation lag changes with a different count, so this page gives no figure. A different count draws a different set of marks on the same price data, so check the setting before you compare two charts.
A fractal describes past price. It shows that a middle bar was the highest or lowest of five bars. It does not show that price will reverse, that a level will hold or that a move will continue.
The indicator does not say how much to trade, where to place a stop loss or whether a level is worth using. A risk-reward ratio check is one way to look at a trade plan first.
This guide explains the fractals indicator in general and does not describe an RTX5 feature. No RTX5 release record confirms which indicators, chart types or alerts the product includes. Its Windows desktop client is in preview, and the web and mobile clients are planned. A Google Play listing for Android is published, but the mobile client has no approved release record yet; check the product-availability record before relying on any RTX5 feature.
Check RTX5 product availabilityTrust and methodology
We want you to be able to identify who owns the page, inspect the evidence, understand how tools were used, and challenge anything that looks wrong or out of date.
Published under the RTX5 Editorial Team byline. It identifies the responsible publishing organization; it does not imply that a named lawyer, regulator, financial adviser, or licensed expert approved this page.
3 primary references are listed on this page with context about what each one supports. The source set was checked on .
Automation and AI may help organize research, outline a page, or edit language. They are not treated as sources, are not presented as human experts, and do not remove the publisher's responsibility for the final page.
If a statement is incomplete, unsupported, or outdated, send the exact URL, sentence, and supporting evidence through our contact route. Read the full editorial and corrections policy.
Sources were checked on 10 November 2026. They explain market rules and concepts; they do not certify RTX5 or provide individual financial advice.
The fractals indicator marks a swing high or swing low on a price chart. It uses a five-bar pattern in which the middle bar has the highest high of the set (an up fractal) or the lowest low (a down fractal). TradingView credits Bill Williams and his 1995 book Trading Chaos. It describes past price and does not predict the next move.
The default Williams fractal uses five consecutive bars. The middle bar is the extreme, and two bars sit on each side. TradingView says the default is five candlesticks and that users can change the count. The MetaTrader 5 help page describes a set of at least five successive bars, so it does not fix the count at five.
A fractal needs the two bars to the right of the middle bar before its pattern is complete. That means it is confirmed two bars after the turning point. TradingView describes this as a lag of two or more candlesticks, give or take, and says the indicator does not redraw.
No. A fractal describes a swing point that has already formed. This guide does not present fractals as buy or sell signals and gives no win rate or result. Some traders use confirmed fractal highs and lows as reference levels, but a level being exceeded does not show which way price will move next.
No. This guide covers the fractal only. Bill Williams also developed other indicators, such as the Awesome Oscillator, which has its own guide. That guide describes how the oscillator is constructed, including the Gator. Combinations of tools are a separate topic and are not covered here. Neither page sets out a trading setup, and reading one indicator does not confirm another.