Accountable publisher
Published under the RTX5 Editorial Team byline. It identifies the responsible publishing organization; it does not imply that a named lawyer, regulator, financial adviser, or licensed expert approved this page.
Technical analysis
Support and resistance are price levels or zones on a chart where price has repeatedly stopped falling (support) or stopped rising (resistance). Traders mark them from prior swing highs and lows that price has reacted to more than once. The levels describe past behaviour. They do not show where price will go next.
In brief
Support and resistance are zones that show where price has reacted before, not exact prices. Here is a practical method for marking them, and the errors that make levels misleading.
Support is a price area where buying has tended to be strong enough to stop a decline. Resistance is a price area where selling has tended to be strong enough to stop a rise. Fidelity's learning centre describes support and resistance levels as price areas on a chart that show where a stock's price tends to stop falling (support) or stop rising (resistance). This guide uses the terms the same way for any market.
Support and resistance trading is the use of these levels to decide where to look for trades, where a stop might sit and where a trade idea stops being valid. The idea rests on supply and demand, but no chart shows the orders behind a level. You infer the level from the price record, so it is a judgement about history, not a measurement.
Support and resistance are not limited to horizontal lines. A sloped trendline is a related but separate tool, and it is covered in how to draw trendlines.
The method below uses only the price record on your chart. Work through it in order, and write down the timeframe you used so that another reader can see where each zone came from.
Mark the main zones on a daily or weekly chart first, then move down to your trading timeframe to refine them. A zone that is clear on a higher chart carries more context than one that appears only on a short chart.
Look back through the chart for points where price turned sharply. A swing high is a peak with lower prices on both sides, and a swing low is the reverse. These turning points are the raw material for most levels.
Note how many times price returned to the same area and reacted. Two touches can justify a tentative zone, and several reactions add more evidence. Repeated touches still do not guarantee the next reaction.
Mark a band that covers the wicks and closes around the turning points. A single exact line suggests a precision the chart does not show. Set the band's width to the normal price noise on your chart.
Note whether price reversed sharply at the area, stalled there, or closed through it. A close beyond a zone is information about the level, not proof that a trade idea has failed or succeeded.
Record when each zone formed, and downgrade or remove levels that price has not revisited for a long time, or that broke and were never retested. Review the map before each session, because the structure changes as new turning points form.
Role reversal is a common chart convention. When price breaks below a support zone, that zone may act as resistance if price rallies back to it. When price breaks above a resistance zone, the zone may act as support on a pullback. Chartists describe this as the level changing role.
Role reversal is an observation about past charts, not a rule. A retest can fail, and a broken level can be ignored by the market. Check whether the break closed clearly beyond the zone, and whether price actually reacted when it returned to the area.
A zone that price broke through is still a zone. Watch how price behaves when it returns, and treat the reaction as one more data point.
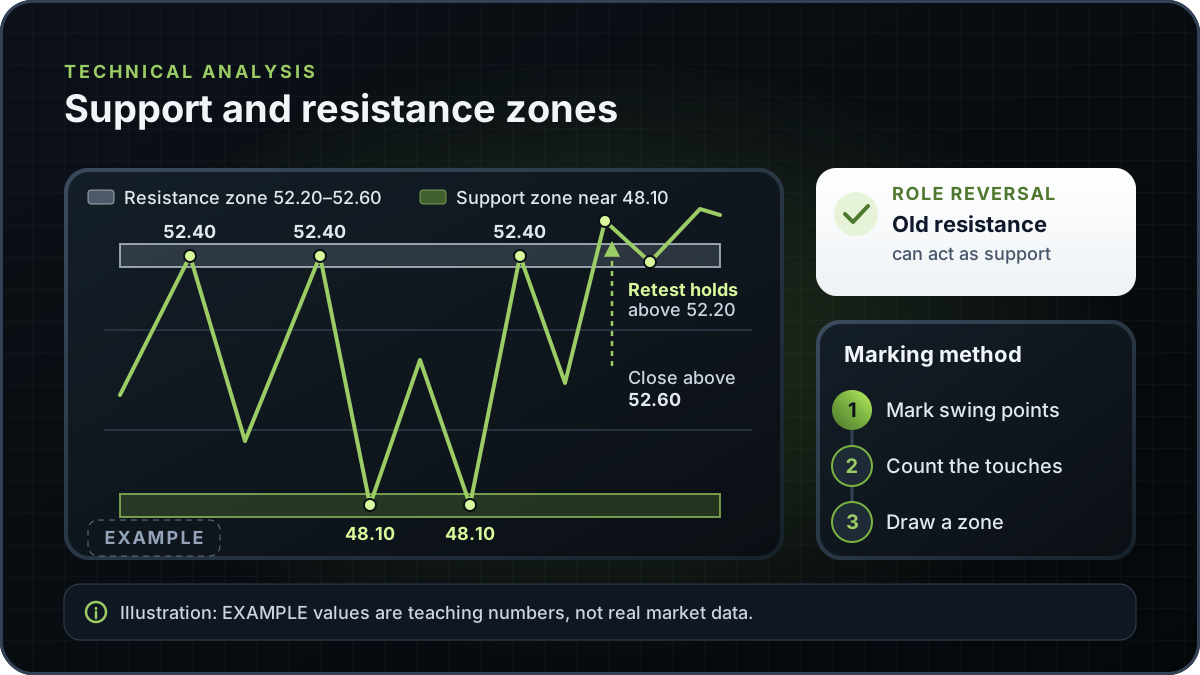
Example: this is an illustrative chart, not a real instrument, date or price history. Assume price peaks near 52.40 on three separate occasions over several weeks and falls back each time. Price has also bottomed near 48.10 twice, bouncing each time. Those two areas are candidates for a resistance zone and a support zone.
Following the method, the 52.40 peaks are prior swing highs with three touches. Draw a zone around them, for example from 52.20 to 52.60, rather than a single line at 52.40, because the three peaks were not identical. The 48.10 lows form a support zone in the same way. Check both zones on a daily chart to see whether they sit inside a larger range.
Suppose price later closes above 52.60 and then returns to the zone without falling back below 52.20. The old resistance zone is now a candidate support zone, which is role reversal on this illustrative chart. It shows what the chart did, and it does not show what price will do next.
The table lists four errors that make levels misleading. The fixes are about evidence and context, not about trading more often.
| Error | What goes wrong | What to check instead |
|---|---|---|
| Too few touches | A single spike or one bounce is treated as a level, so the zone carries little evidence. | Look for several reactions at the same area, and label a level with one touch as tentative. |
| Stale levels | Old zones from months or years earlier stay on the chart after the market structure has changed. | Date each level, and remove or downgrade zones that have not been revisited or were broken and not retested. |
| Over-precise lines | A single exact price implies a precision the market does not give, and a stop placed exactly on the line can be hit by normal noise. | Draw a zone wide enough to cover the wicks and closes around the reaction. |
| Ignoring the higher timeframe | A level on a short chart looks important when the daily chart shows it is minor, or a more important level is missed. | Mark main levels on a higher timeframe first, then refine them on the chart you trade. |
This checklist follows the method on this page. It is a description of common errors, not a study result.
Support and resistance is one chart reading method among several. Price action looks at the sequence of bars and their structure, and candlestick patterns describe the shape of individual bars. Neither replaces a zone you have marked from the price record.
A level from a Fibonacci retracement is calculated from one prior move, while a support or resistance zone is marked from where price has actually reacted. The two can coincide on a chart, but a coincidence is not confirmation of either.
Pick one instrument and one higher timeframe. Mark two or three zones with the method above, label each with its timeframe and date, and review them after each session. Then compare what price did at each zone before you change any level. Practise on past charts or a demo account before you use the method with real money.
You can mark these zones on any chart you use. The charts page is an RTX5 product page, so check the product-availability record for which chart features are live before relying on them.
RTX5 is Orrnn's trading terminal and broker-technology product. Its Windows desktop client is in preview, and the web and mobile clients are planned. A Google Play listing for Android is published, but the mobile client has no approved release record yet; check the product-availability record before relying on any RTX5 feature. The chart examples on this page are illustrative and do not come from an RTX5 feature.
Check RTX5 product availabilityTrust and methodology
We want you to be able to identify who owns the page, inspect the evidence, understand how tools were used, and challenge anything that looks wrong or out of date.
Published under the RTX5 Editorial Team byline. It identifies the responsible publishing organization; it does not imply that a named lawyer, regulator, financial adviser, or licensed expert approved this page.
3 primary references are listed on this page with context about what each one supports. The source set was checked on .
Automation and AI may help organize research, outline a page, or edit language. They are not treated as sources, are not presented as human experts, and do not remove the publisher's responsibility for the final page.
If a statement is incomplete, unsupported, or outdated, send the exact URL, sentence, and supporting evidence through our contact route. Read the full editorial and corrections policy.
Sources were checked on 9 November 2026. They explain market rules and concepts; they do not certify RTX5 or provide individual financial advice.
Support is a price area where falling prices have tended to stop, because buying has been strong enough to halt the decline. Resistance is a price area where rising prices have tended to stop, because selling has pushed back. The two are defined by the direction price approached from, and a level can change role after a clear break.
No fixed number is standard. Two touches can justify a tentative zone, and more reactions usually add evidence, but a level with many touches can still fail. Use touches as one input, alongside the timeframe, how recent the reactions were, and whether price closed through the area. This guide does not set a minimum.
No. Horizontal zones are the most common form, but support and resistance can also form along sloped trendlines and at prior highs and lows that sit at an angle. Trendlines are a separate tool, covered in how to draw trendlines. Whichever form you use, mark it as a zone and state the timeframe it came from.
They describe where price has reacted before, and they do not predict where price will go. A Federal Reserve Bank of New York study found that levels provided to customers by six foreign-exchange firms helped predict intraday exchange-rate trend interruptions, but the results varied across exchange rates and firms. Treat levels as a map of past behaviour, and combine them with risk limits you set before you trade.
Start on a higher timeframe, such as a daily or weekly chart, to find the main zones, then move to your trading timeframe to refine them. Levels that appear only on a short chart may matter less in the wider context. Put the timeframe on the chart label, so you can tell which level a zone came from.