Accountable publisher
Published under the RTX5 Editorial Team byline. It identifies the responsible publishing organization; it does not imply that a named lawyer, regulator, financial adviser, or licensed expert approved this page.
Technical analysis
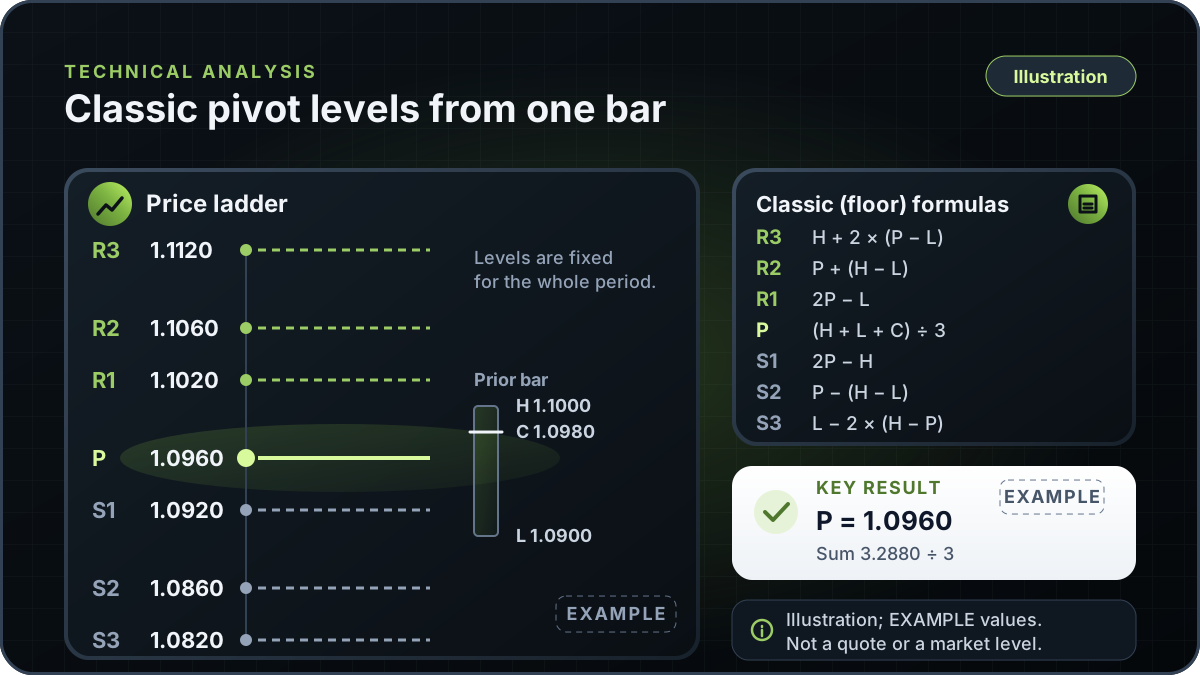
Pivot points are reference price levels calculated from the prior period's high, low and close. The classic (floor) method averages those three prices to get a pivot point (P), then places resistance levels (R1 to R3) above it and support levels (S1 to S3) below it. The levels describe past prices and do not forecast them.
In brief
A pivot point is a fixed reference built from earlier prices. This guide covers the classic formula, a worked Example, the main variants and the choices that decide which prior bar is used.
Pivot points are a set of price levels drawn for one trading period, such as a day or a week. StockCharts describes them as levels that use the prior period's high, low and close to estimate support and resistance, with the pivot point in the middle. StockCharts says floor traders originally used the method to set key levels.
In the classic method the levels are worked out once, from data that has already happened, and they stay fixed for the period. A pivot point is a reference built from past prices, not a view of what price will do next. For the wider idea, see support and resistance.
The classic method uses the prior period's high (H), low (L) and close (C). The pivot point (P) is the simple average of those three prices, and the other levels are built from P together with the prior high and low. The table gives the Traditional set from TradingView's article.
| Level | Formula | Example value |
|---|---|---|
| P (pivot point) | (H + L + C) / 3 | 1.0960 |
| R1 | 2P - L | 1.1020 |
| S1 | 2P - H | 1.0920 |
| R2 | P + (H - L) | 1.1060 |
| S2 | P - (H - L) | 1.0860 |
| R3 | H + 2 x (P - L) | 1.1120 |
| S3 | L - 2 x (H - P) | 1.0820 |
Formulas: TradingView support, 'Pivot Points Standard', Traditional set. TradingView writes R3 as 2P + (H - 2L) and S3 as 2P - (2H - L), which are algebraically equal to the forms shown. Example values use H = 1.1000, L = 1.0900 and C = 1.0980, which are illustrative. Checked 10 November 2026.
The Classic option in the same TradingView article uses P + 2 x (H - L) for R3, which gives a different outer level from the Traditional set.
This Example uses round numbers, not a real quote. Assume a prior high of 1.1000, a low of 1.0900 and a close of 1.0980. The range, H minus L, is 0.0100.
Step 1: P = (1.1000 + 1.0900 + 1.0980) / 3 = 3.2880 / 3 = 1.0960. Step 2: R1 = (2 x 1.0960) - 1.0900 = 1.1020, and S1 = (2 x 1.0960) - 1.1000 = 1.0920. Step 3: R2 = 1.0960 + 0.0100 = 1.1060, and S2 = 1.0960 - 0.0100 = 1.0860. Step 4: R3 = 1.1000 + 2 x (1.0960 - 1.0900) = 1.1000 + 0.0120 = 1.1120, and S3 = 1.0900 - 2 x (1.1000 - 1.0960) = 1.0900 - 0.0080 = 1.0820.
In order from the bottom, the Example levels are 1.0820 (S3), 1.0860 (S2), 1.0920 (S1), 1.0960 (P), 1.1020 (R1), 1.1060 (R2) and 1.1120 (R3). The distance from P to R1 is 0.0060, and from P to S1 is 0.0040. The levels are not evenly spaced. That comes from the arithmetic, not the market, and the Example does not say price will turn at R1 or S1.
Several variants share the name pivot points but use different formulas. TradingView's support article lists six pivot types, and StockCharts covers Standard, Demark and Fibonacci pivots.
| Variant | Formula as stated | Source |
|---|---|---|
| Classic (floor), Traditional set | P = (H + L + C) / 3; R1 = 2P - L; S1 = 2P - H; R2 = P + (H - L); S2 = P - (H - L); R3 = H + 2(P - L); S3 = L - 2(H - P) | TradingView support; StockCharts describes the same average base |
| TradingView 'Classic' option | Same P, R1, S1, R2 and S2; R3 = P + 2 x (H - L); S3 = P - 2 x (H - L) | TradingView support |
| Fibonacci | P = (H + L + C) / 3; R1 and S1 = P plus or minus 0.382 x (H - L); R2 and S2 = P plus or minus 0.618 x (H - L); R3 and S3 = P plus or minus 1 x (H - L) | TradingView support; StockCharts uses 38.2%, 61.8% and 100% of the range |
| Woodie | P = (H + L + 2 x O) / 4, where O is the open of the current bar; R1 = 2P - L; S1 = 2P - H; R2 = P + (H - L); S2 = P - (H - L) | TradingView support |
| Camarilla | P = (H + L + C) / 3; R1 = C + 1.1 x (H - L) / 12; S1 = C - 1.1 x (H - L) / 12; R2, R3 and R4 use the same form with / 6, / 4 and / 2 | TradingView support |
| Demark (DM) | X depends on the close against the open: if C < O, X = H + 2L + C; if C > O, X = 2H + L + C; if C = O, X = H + L + 2C. Then P = X / 4, R1 = X / 2 - L and S1 = X / 2 - H, with one resistance and one support | StockCharts ChartSchool; TradingView support gives the same X rules |
The Traditional R3 and S3 are written here as H + 2(P - L) and L - 2(H - P). TradingView writes them as 2P + (H - 2L) and 2P - (2H - L), which are algebraically equal. The variant names are as TradingView and StockCharts use them. Woodie and Camarilla are described in TradingView's article only. Checked 10 November 2026.
Two platforms can label a set Fibonacci or Camarilla and draw different levels, so check the formula in your settings before comparing charts.
The period you choose sets the prior high, low and close. StockCharts maps chart timeframes to periods: 1- to 15-minute charts use the prior day, 30- to 120-minute charts use the prior calendar week, daily charts use the prior month, and weekly and monthly charts use the prior year.
TradingView's 'Auto' setting follows a similar mapping: a daily period up to and including 15-minute charts, a weekly period for longer intraday charts, and a monthly period for daily and larger charts.
The time zone and session boundary decide where the prior day starts and ends. TradingView's support article says the futures daily candle uses Electronic Trading Hours. For stocks, the same article says extended-hours data, if provided, is usually not included in the daily candle. Neither cited reference states the time zone a chart uses for its day boundary, so check your platform's session settings. For forex and other 24-hour markets, the day boundary is a platform or broker choice that the cited sources do not set.
Exchange holidays add a further question, because the prior trading bar can fall on a different date. The cited sources do not say how each platform handles this. See the stock market holidays guide and your exchange's official calendar.
StockCharts describes one common convention: a move above the pivot is read as strength, and a move below it as weakness. The cited source does not show that this works, and this guide does not present it as a signal. StockCharts also calls pivot points predictive or leading indicators. This guide does not adopt that framing, since the cited sources give no accuracy evidence for it.
A level that lines up with a prior swing or a Fibonacci retracement level is not more certain for that reason. StockCharts notes that confirming pivot readings with other technical aspects is important.
This guide explains pivot points in general and does not describe an RTX5 feature. No RTX5 release record confirms which indicators, chart types or alerts the product includes. RTX5 is Orrnn's trading terminal and broker-technology product. Its Windows desktop client is in preview, and the web and mobile clients are planned. A Google Play listing for Android is published, but the mobile client has no approved release record yet; check the product-availability record before relying on any RTX5 feature.
Check RTX5 product availabilityTrust and methodology
We want you to be able to identify who owns the page, inspect the evidence, understand how tools were used, and challenge anything that looks wrong or out of date.
Published under the RTX5 Editorial Team byline. It identifies the responsible publishing organization; it does not imply that a named lawyer, regulator, financial adviser, or licensed expert approved this page.
3 primary references are listed on this page with context about what each one supports. The source set was checked on .
Automation and AI may help organize research, outline a page, or edit language. They are not treated as sources, are not presented as human experts, and do not remove the publisher's responsibility for the final page.
If a statement is incomplete, unsupported, or outdated, send the exact URL, sentence, and supporting evidence through our contact route. Read the full editorial and corrections policy.
Sources were checked on 10 November 2026. They explain market rules and concepts; they do not certify RTX5 or provide individual financial advice.
The classic (floor) pivot point is P = (High + Low + Close) / 3, using the high, low and close of the prior period. The first resistance is R1 = 2P minus the Low, and the first support is S1 = 2P minus the High. Other variants use different formulas, so check which one your chart uses.
No single period is correct. StockCharts maps intraday charts to the prior day or prior week, and daily charts to the prior month. The right choice depends on the time frame you study and the session your platform uses. Check the period setting in your platform before comparing levels, since the setting decides which prior bar is used.
No. Fibonacci pivots use the same pivot point, P, but add or subtract 38.2%, 61.8% and 100% of the prior range to form the other levels. A Fibonacci retracement is a different tool that measures a move between two chosen price points. Both use Fibonacci ratios, but they are different tools with different inputs.
No. Pivot points are calculated from past prices and estimate possible support and resistance. Price can pass through any level without a reaction. This guide gives no win rate or performance figure, and does not present the levels as a forecast or a signal.
The formula can be applied to any price data, but it does not set the day boundary. A 24-hour market has no single exchange close, so the platform's or broker's day settings decide the prior high, low and close. The cited sources do not state which boundary to use.