Accountable publisher
Published under the RTX5 Editorial Team byline. It identifies the responsible publishing organization; it does not imply that a named lawyer, regulator, financial adviser, or licensed expert approved this page.
Technical analysis
Fibonacci retracement is a chart tool that divides the move between a swing low and a swing high into horizontal levels at 23.6, 38.2, 50, 61.8 and 78.6 percent. Traders use these Fibonacci retracement levels as reference points for pullbacks. The levels are drawing conventions, not laws, and they do not predict reversals.
In brief
A fibonacci retracement measures how far price has pulled back within a move. Here is where the ratios come from, how to draw the levels step by step, and the mistakes that change the drawing.
A Fibonacci retracement is a set of horizontal lines drawn across a price move. The move runs from a swing low to a swing high, or the reverse. Each line marks how far price has pulled back from the end of the move, as a share of the range between the two swing points. Fidelity's technical indicator guide describes the same construction: a trend line is drawn between two extreme points, and the percentages are applied to the difference between the high and the low.
Fidelity's guide lists six lines: 0, 23.6, 38.2, 50, 61.8 and 100 percent, where the two outer lines are the swing points themselves. The 78.6 percent level is not on that list, so check which lines your own platform plots, including whether it adds 78.6 percent. For the broader idea of prices that have stalled before, see support and resistance.
The Fibonacci sequence runs 1, 1, 2, 3, 5, 8 and so on, where each number is the sum of the two before it. The sequence comes from Fibonacci's Liber abaci, which the University of St Andrews MacTutor archive dates to 1202. As the sequence grows, the ratio of one number to the next settles towards 0.618. The ratio of alternate numbers settles towards 0.382. The Wolfram MathWorld entry on Fibonacci numbers states that ratios of successive terms approach the golden ratio, and that alternate ratios converge to the inverse square of that ratio. The same arithmetic shows that numbers three places apart settle towards 0.236: for example, 55 divided by 233 is about 0.236.
The golden ratio is about 1.618, and its inverse is about 0.618. The 61.8 percent level is the inverse golden ratio, 38.2 percent is the inverse square and 23.6 percent is the inverse cube. These three levels are whole-number powers of the golden ratio, and each is a value that ratios of Fibonacci numbers approach.
The 50 percent level is different: it is not a power of the golden ratio, and no ratio in the sequence settles towards it, so it is a convention. The 78.6 percent level is about 0.786, the square root of 0.618, which is the golden ratio raised to the power minus one half. That is a fractional power, and ratios of Fibonacci numbers settle only towards whole-number powers such as 0.618, 0.382 and 0.236. Label 50 percent as a convention, and do not present 78.6 percent as a ratio from the sequence.
This section shows how to use Fibonacci retracement on a chart. Choose the swing points first, then set the tool. The steps below assume an uptrend, where the swing low comes first. For a downtrend, reverse the order.
Locate the most recent clear swing low and the swing high that ends the up move. Use the same price convention each time, and note the timeframe you used.
Click the tool on the swing low and drag it to the swing high. Check which end point your platform labels as 0 percent, because the labels can run in the opposite direction to what you expect.
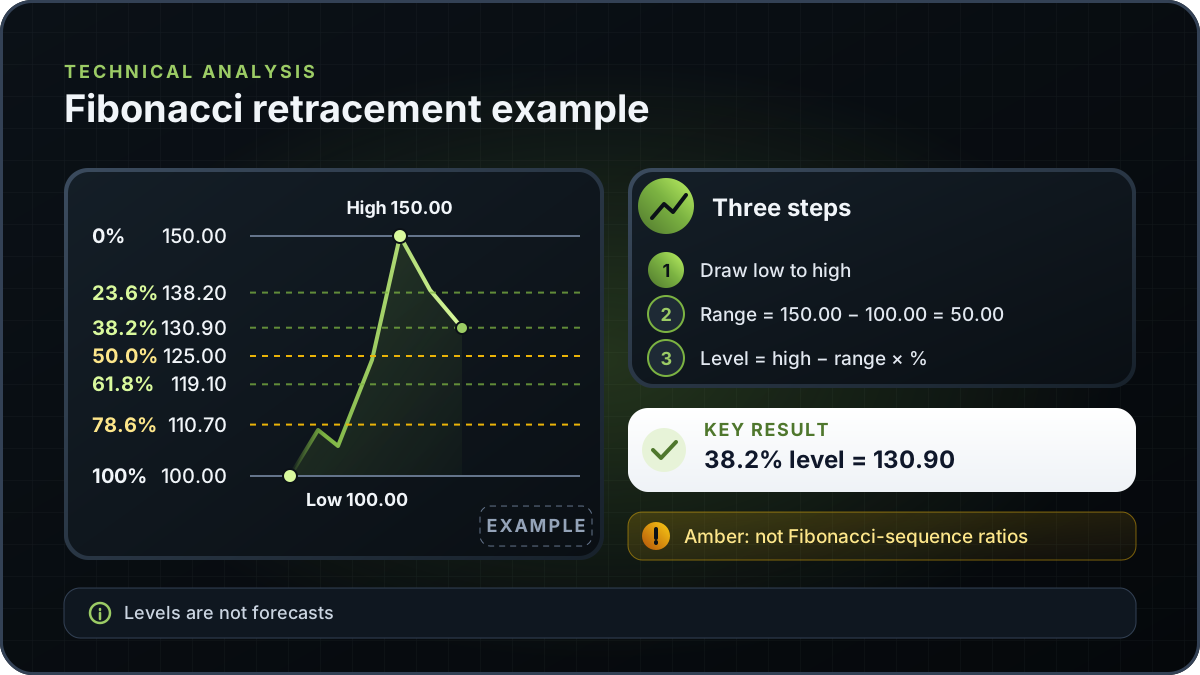
The range is the swing high minus the swing low. Each retracement level is a fraction of that range, measured back from the high in an uptrend.
Check that the 23.6, 38.2, 50, 61.8 and 78.6 percent lines are present. Compare one of them with your own arithmetic, as the worked example below does.
In a downtrend, draw from the swing high to the swing low. The levels then measure how far a bounce up has travelled from the low, and they sit above the low.
Redraw when a new swing forms, and date the drawing. An old drawing can describe a range that no longer matters.
This is an illustrative example with round numbers. It is not a market quote and not a trading suggestion. Assume an uptrend with a swing low at 100.00 and a swing high at 150.00. The range is 150.00 minus 100.00, which is 50.00. Each level price is the swing high minus the range multiplied by the percentage.
| Level | Calculation | Level price |
|---|---|---|
| 23.6% | 50.00 x 0.236 = 11.80 | 150.00 - 11.80 = 138.20 |
| 38.2% | 50.00 x 0.382 = 19.10 | 150.00 - 19.10 = 130.90 |
| 50.0% | 50.00 x 0.500 = 25.00 | 150.00 - 25.00 = 125.00 |
| 61.8% | 50.00 x 0.618 = 30.90 | 150.00 - 30.90 = 119.10 |
| 78.6% | 50.00 x 0.786 = 39.30 | 150.00 - 39.30 = 110.70 |
Example figures only. Prices are rounded to two decimal places and are not a quote for any instrument.
In a downtrend with a swing high at 150.00 and a swing low at 100.00, the same percentages are added to the low instead: 111.80 (23.6%), 119.10 (38.2%), 125.00 (50.0%), 130.90 (61.8%) and 139.30 (78.6%). Every level must sit between the two swing points, which is a quick check that the drawing is the right way round.
Most errors come from the anchor points or the direction of the drawing, not from the arithmetic. The table lists the mistakes that change the levels most often, with a fix for each.
| Mistake | What goes wrong | Fix |
|---|---|---|
| Anchoring on a swing that is not a clear turn | Small wiggles move the levels, so the drawing looks precise but has no firm reference. | Anchor on a swing the chart shows clearly, and state the timeframe. |
| Treating 50 percent as a Fibonacci ratio | The sequence gets credit for a level it does not produce. | Label 50 percent as a convention, as this page does. |
| Drawing in the wrong direction for the trend | The levels do not show the pullback you are measuring. | Draw low to high in an uptrend and high to low in a downtrend. |
| Reading a level as a target or a reversal | Nothing in the tool shows that price will react at the level, and a level that held before may not hold again. | Use the level as a reference only, and test it against other evidence and your own data. |
| Keeping drawings after new swings form | The levels describe a range that is no longer the current structure. | Redraw from the latest swing points and date the drawing. |
| Ignoring the platform's labels | Platforms can put 0 percent at the start point or the end point, so the same drag can give mirror-image levels. | Check the labels after drawing, and confirm one level against the arithmetic. |
The levels describe arithmetic on a price range. They do not show why price moved, how long a pullback will last or whether it will reverse. Fidelity's guide describes the levels as support and resistance that traders can use to set price objectives. It also says that countertrend moves tend to fall into certain parameters, which it often identifies as the retracement levels. That describes how some traders use the levels. It is not evidence that the levels predict prices.
A level that a pullback respected in the past is a record of past price, not a forecast. Test any use of the levels on your own data, across many examples, before you rely on them. For a different framework that describes the same price moves as waves, read Elliott wave theory. For the lines that frame a trend, read how to draw trendlines, and for the wider market context see technical analysis.
RTX5 is Orrnn's trading terminal and broker-technology product. Its Windows desktop client is in preview, and the web and mobile clients are planned. A Google Play listing for Android is published, but the mobile client has no approved release record yet; check the product-availability record before relying on any RTX5 feature. The worked example on this page is arithmetic only and does not come from an RTX5 feature.
Check RTX5 product availabilityTrust and methodology
We want you to be able to identify who owns the page, inspect the evidence, understand how tools were used, and challenge anything that looks wrong or out of date.
Published under the RTX5 Editorial Team byline. It identifies the responsible publishing organization; it does not imply that a named lawyer, regulator, financial adviser, or licensed expert approved this page.
4 primary references are listed on this page with context about what each one supports. The source set was checked on .
Automation and AI may help organize research, outline a page, or edit language. They are not treated as sources, are not presented as human experts, and do not remove the publisher's responsibility for the final page.
If a statement is incomplete, unsupported, or outdated, send the exact URL, sentence, and supporting evidence through our contact route. Read the full editorial and corrections policy.
Sources were checked on 9 November 2026. They explain market rules and concepts; they do not certify RTX5 or provide individual financial advice.
A Fibonacci retracement is a set of horizontal lines drawn across a swing low and a swing high, at 23.6, 38.2, 50, 61.8 and 78.6 percent of the range, measured back from the end of the move. The levels describe arithmetic on a price range and do not show that price will reverse at any of them.
Only some of them. The 23.6, 38.2 and 61.8 percent levels are values that ratios of Fibonacci numbers approach. The 50 percent level is a convention. The 78.6 percent level is about the square root of 0.618, a fractional power of the golden ratio that the sequence ratios do not produce. Whichever levels you use, the Fibonacci name does not make a level more likely to hold.
No. The levels show where fixed percentages of a chosen range sit. They do not show whether price will stop, bounce or reverse at a level. Some traders use them as reference points, and a level that held before may not hold again. Test any use of them on your own data before relying on them, and treat the output as a description of the chart.
Draw from the swing low to the swing high in an uptrend, and from the swing high to the swing low in a downtrend. Many tools label the start and end points differently, so check the labels after you draw. Choose swing points that are clear on your chart, and state the timeframe you used.
Tools can differ in the points they anchor to, the price convention they use, and whether the 0 percent line sits at the start or the end point. Two drawings can therefore differ and still be correct for their settings. Check how your platform labels the 0 and 100 percent lines, and confirm one level against the arithmetic on this page.