Accountable publisher
Published under the RTX5 Editorial Team byline. It identifies the responsible publishing organization; it does not imply that a named lawyer, regulator, financial adviser, or licensed expert approved this page.
Technical analysis
Elliott wave theory is a method of technical analysis introduced by R. N. Elliott in his 1938 book The Wave Principle. It holds that prices move in five waves in the trend's direction, then three waves (A-B-C) against it. Wave counts are subjective, and a count describes past price rather than forecasting the next move.
In brief
A wave count is a label for past price, not a forecast. Here is what the theory describes, the rules analysts check, and why the method cannot be relied on to predict prices.
R. N. Elliott introduced the wave principle in his 1938 book The Wave Principle. A 2006 Cass Business School discussion paper by Roy Batchelor and Richard Ramyar summarises his basic idea: the market typically rises in five phases and then falls in three, and the pattern repeats at every data frequency, from a century of stock market history to a chart of five-minute bars.
The same paper notes that Elliott believed the pattern followed from an underlying mathematical principle, which he set out in a 1946 book, Nature's Law. It adds that the method was much elaborated and popularised from the 1970s onwards by Prechter and Frost.
It is safest to read the theory as a set of conventions for labelling price structure, not as a complete model of markets. For the wider set of chart tools and the limits they share, see technical analysis.
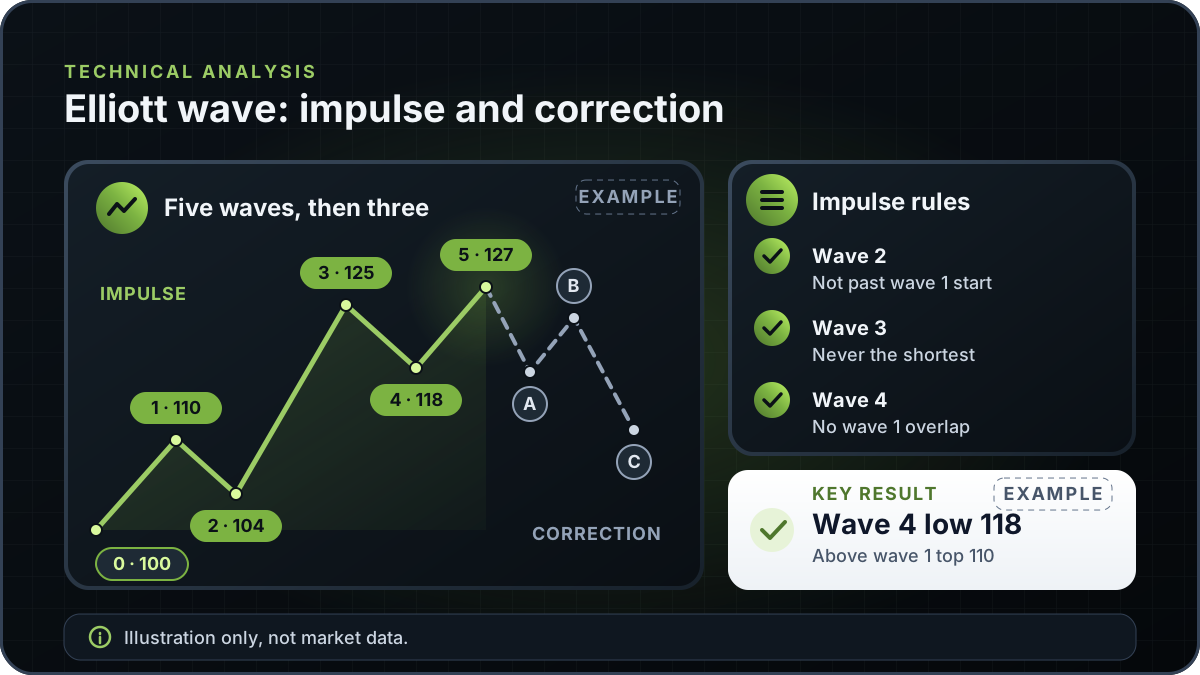
In Elliott's scheme a trend is an impulse of five waves, labelled 1 to 5. Waves 1, 3 and 5 move in the direction of the trend, and waves 2 and 4 pull back against it. A correction is a move of three waves, labelled A, B and C, that runs against the preceding impulse.
The table compares the two structures as practitioners commonly describe them.
| Feature | Impulse wave | Corrective wave |
|---|---|---|
| Labels | 1, 2, 3, 4, 5 | A, B, C |
| Direction | Waves 1, 3 and 5 move with the trend | Moves against the preceding impulse |
| Number of subwaves | Five | Three |
| Typical role | Carries the trend | Pauses or reverses the trend before the next impulse |
| Hard rules | Three rules are commonly stated and treated as firm | Few hard rules, so shapes vary and counts are more open to interpretation |
General convention, not a measured result. Practitioner texts word these points differently, so check a textbook on the wave principle for the full rule set and its exceptions.
The practical difference is the rule set. An impulse must satisfy several conditions to be counted, while a correction can take several shapes. That is why correction counts are usually more open to interpretation than impulse counts.
Practitioner accounts of the theory usually list three rules for an impulse. They are a labelling convention, not a tested finding, and they are checks on a count rather than signals to trade. If a candidate count breaks one of them, the labels need to be changed.
This example uses illustrative price levels, not market data. Suppose an analyst labels a rally as follows. Wave 1 runs from 100 to 110, a move of 10 points. Wave 2 falls to 104, retracing 6 of the 10 points, or 60% of wave 1. Wave 3 runs from 104 to 125, a move of 21 points. Wave 4 falls to 118. Wave 5 runs from 118 to 127, a move of 9 points.
Test the count against the rules. Wave 2 bottoms at 104, which is above the 100 start of wave 1, so it passes. Wave 3 at 21 points is not the shortest, because wave 5 at 9 points is shorter. Wave 4 bottoms at 118, which is above the 110 top of wave 1, so it does not overlap. All three rules hold, and the count is valid under the basic rules.
Now change one number. If wave 4 had fallen to 109, it would have entered the 100 to 110 territory of wave 1. The impulse count would fail, and the analyst would need to relabel the move or drop the count. The example shows that the rules can reject a count, but they cannot choose between two counts that both pass.
A corrective wave has three subwaves, A, B and C. As the structure is commonly described, wave A is often hard to identify in real time, because early moves against the trend can look like a normal pullback. Wave B is a rally that many analysts read as a return of the prior trend. Wave C is a move that carries the price beyond the end of wave A.
Because corrections can take different shapes, a single chart can be labelled as a correction in several ways. Reading the candles and the structure around each wave is a separate skill. For that, see what is price action trading.
Batchelor and Ramyar note that in a later newsletter, dated 1940, Elliott claimed that the ratios of price and time retracements and projections in successive waves were likely to conform to Fibonacci ratios. Many analysts still use Fibonacci levels to estimate where a correction may end. Those levels are guidelines, not rules, and the tool is covered on its own in Fibonacci retracement.
The method has four weaknesses. Each one matters before you use a count to make a decision.
The theory does not say when a wave ends or how far the next move goes. A count describes a sequence that has already happened. It cannot tell you, on its own, whether the current rally is wave 3 or wave B of a larger correction.
Write the count down before the move, not after it. Note the price level that would invalidate the count, such as a break of the wave 1 start or an overlap into wave 1. Compare the count with other evidence, such as support and resistance levels, and with the market's volume and news flow.
Position size and loss limits still matter when a count looks clear. A wave label does not reduce the risk of a trade, and a count can fail on a single move. The risk management section of this site covers the controls that apply to any method.
RTX5 is Orrnn's trading terminal and broker-technology product. Its Windows desktop client is in preview, and the web and mobile clients are planned. A Google Play listing for Android is published, but the mobile client has no approved release record yet; check the product-availability record before relying on any RTX5 feature. This page describes the theory in general and does not show an RTX5 wave-counting feature.
Check RTX5 product availabilityTrust and methodology
We want you to be able to identify who owns the page, inspect the evidence, understand how tools were used, and challenge anything that looks wrong or out of date.
Published under the RTX5 Editorial Team byline. It identifies the responsible publishing organization; it does not imply that a named lawyer, regulator, financial adviser, or licensed expert approved this page.
4 primary references are listed on this page with context about what each one supports. The source set was checked on .
Automation and AI may help organize research, outline a page, or edit language. They are not treated as sources, are not presented as human experts, and do not remove the publisher's responsibility for the final page.
If a statement is incomplete, unsupported, or outdated, send the exact URL, sentence, and supporting evidence through our contact route. Read the full editorial and corrections policy.
Sources were checked on 9 November 2026. They explain market rules and concepts; they do not certify RTX5 or provide individual financial advice.
Elliott wave theory describes market price as a repeating sequence of waves. A trend is a five-wave impulse in its own direction, and a correction against it is three waves labelled A, B and C. Analysts use the labels to describe price structure. The labels are interpretations of past price, not a forecast of what happens next.
R. N. Elliott introduced the wave principle in his 1938 book The Wave Principle. In a 1940 newsletter he linked wave ratios to Fibonacci numbers, and in a 1946 book, Nature's Law, he argued that the pattern followed a wider mathematical principle. Prechter and Frost elaborated and popularised the method from the 1970s onwards.
The three impulse rules commonly stated by practitioners are these. Wave 2 never retraces more than 100% of wave 1. Wave 3 is never the shortest of waves 1, 3 and 5. Wave 4 does not enter the price territory of wave 1. Corrective waves do not have the same hard rules. A count that breaks one of the impulse rules needs to be relabelled.
A wave count is not a forecast, and one of the theory's key claims has tested poorly. A 2006 Cass Business School study of the Dow Jones Industrial Average from 1914 to 2002 found no more Fibonacci or round-number ratios between successive trends than chance would produce. Wave counts are also subjective. Test any approach on your own data before you use it with real money.
Elliott wave theory labels the sequence of waves in a trend and its correction. Fibonacci retracement is a set of price levels, such as 38.2% and 61.8%, drawn between a swing high and a swing low. Many analysts use the two together, but the levels are guidelines, and a level does not prove that a wave has ended.
Yes. A wave count is a hypothesis about past price, and it can be wrong when the next move breaks its rules or invalidation level. Good practice is to write the count down before the move, note the level that would invalidate it, and review the count when new price data arrives. A count that has failed should be relabelled, not defended.