Accountable publisher
Published under the RTX5 Editorial Team byline. It identifies the responsible publishing organization; it does not imply that a named lawyer, regulator, financial adviser, or licensed expert approved this page.
Chart reading
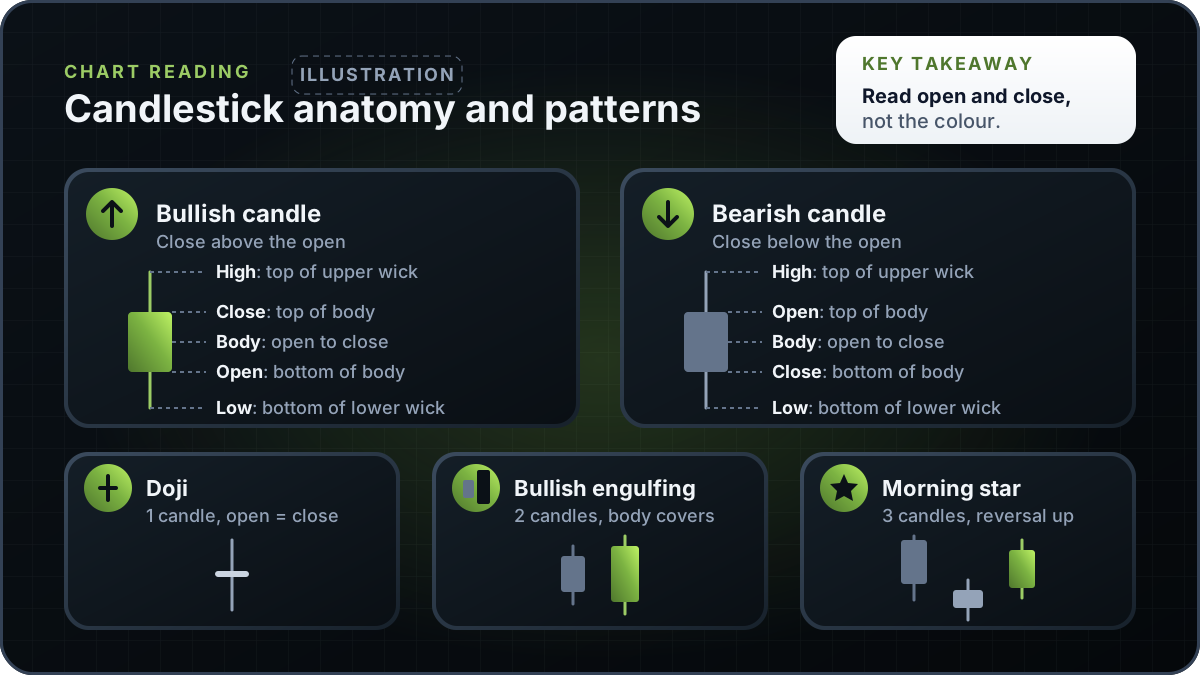
Candlestick patterns are shapes formed by one or more candlesticks, each showing the open, high, low and close for a set period. A candlestick's body shows the range between open and close, and its wicks show the high and low. Traders use patterns to describe recent price action, but a pattern does not prove what will happen next.
In brief
A candlestick is a compact record of one period of price. Here is how to read its body and wicks, the common single- and multi-candle shapes, and why no shape proves what happens next.
A candlestick is a way of drawing the price data for one period, such as one minute, one hour or one day. Each candle carries four prices: the open, the high, the low and the close. The open is the price at the start of the period, the close is the price at the end, and the high and low are the extremes reached in between.
The body is the thick part of the candle, drawn between the open and the close. The wicks, also called shadows, are the thin lines above and below the body. The upper wick reaches up to the high and the lower wick reaches down to the low. If a candle has no upper wick, its high was the top of the body. The Nasdaq glossary entry for the candlestick chart describes the same construction: a box called the real body, with vertical lines above and below it showing the high and low.
The CMT Association, a credentialing body for technical analysis, describes technical analysis as a methodology that evaluates financial markets by analysing statistical patterns in market data, such as price movement, volume and momentum. The Nasdaq glossary defines technical analysis as security analysis that seeks to detect and interpret patterns in past security prices. Candlestick patterns are one small part of that work. For the wider background, read what is price action trading.
A bullish candle has a close above its open, meaning price finished the period higher than it started. A bearish candle has a close below its open. The Nasdaq glossary describes white-bodied boxes for upward movement and black-bodied boxes for downward movement. Many platforms use green and red instead, and most let you change the colours, so read the open and close rather than the colour.
Two candles can look alike and still differ in meaning. A long body with short wicks shows that price moved most of the way in one direction during the period. A short body with long wicks shows that price moved sharply both ways and then settled near the open. Neither shape says what the next period will bring.
The table lists nine common single-candle, two-candle and three-candle patterns. Each row describes the shape and what it shows about one session. The pattern names and shapes are common conventions in trading education. The sources on this page define the candle itself, not these patterns, and none of them tests how often a pattern is followed by a particular move.
| Pattern | Candles | Shape | What it shows about the session | What it does not prove |
|---|---|---|---|---|
| Doji | 1 | Open and close nearly equal, so the body is a thin line with wicks | Buyers and sellers were roughly balanced by the close | The direction of the next period, or that a trend has ended |
| Hammer | 1 | Small body near the top, long lower wick, little or no upper wick | Price fell during the period, then recovered most of the way | That the recovery will continue or that the low will hold |
| Shooting star | 1 | Small body near the bottom, long upper wick, little or no lower wick | Price rose during the period, then fell back toward the open | That the high will hold or that a downtrend will follow |
| Bullish engulfing | 2 | A bullish candle whose body fully covers the body of the prior bearish candle | Buyers took control from sellers across the two periods | That the upward move will last |
| Bearish engulfing | 2 | A bearish candle whose body fully covers the body of the prior bullish candle | Sellers took control from buyers across the two periods | That the downward move will last or that the trend has reversed |
| Bullish harami | 2 | A small bullish candle inside the body of a prior large bearish candle | Selling pressure slowed after the prior period | That the decline has ended |
| Bearish harami | 2 | A small bearish candle inside the body of a prior large bullish candle | Buying pressure slowed after the prior period | That the advance has ended |
| Morning star | 3 | A large bearish candle, a small body after a pause or gap, then a large bullish candle | Selling faded and buyers returned over three periods | That the reversal will hold or that the next move will be up |
| Evening star | 3 | A large bullish candle, a small body after a pause or gap, then a large bearish candle | Buying faded and sellers returned over three periods | That the reversal will hold or that the next move will be down |
Pattern names and shapes are common conventions, not findings from a study, and the table is not a forecast. Definitions vary between sources and platforms, so check your own.
A single-candle pattern is read from one candle, so its meaning depends on where it appears. A doji forms when the open and close are nearly equal. It shows that the period ended close to where it began, but it does not show which side wins the next period. A doji after a long run higher reads differently from one in a quiet range.
A hammer has a small body near the top and a long lower wick. Price fell during the period and then recovered most of the way. A shooting star is the mirror image, with a small body near the bottom and a long upper wick that shows price was pushed back from higher levels. Many traders wait for the next candle before acting, but that is a habit, not a rule.
For how prior levels can change what a candle means, see support and resistance.
Two-candle patterns compare the second candle with the first. In an engulfing pattern the second body covers the first body completely and the colours are opposite. A bullish engulfing follows a bearish candle, and a bearish engulfing follows a bullish candle. The second candle shows that one side took over the whole of the previous body.
A harami reverses the relationship. The second candle is small and sits inside the body of the large first candle. It shows that the move slowed, but it does not show a reversal. Some traders read a harami as a sign that momentum has eased.
Morning and evening star patterns use three candles. The first is a large candle in the direction of the prior move. The second is a small body that shows indecision. The third is a large candle in the opposite direction. A morning star follows a decline and an evening star follows an advance.
The sequence describes past prices. Check whether the pattern formed in a clear trend, near a level the market has respected before, and whether volume supports the move.
The same candle can mean different things in different places. A hammer at the bottom of a long decline, at a level that has held before, is a different read from a hammer in the middle of a quiet range. Start with the trend, then the nearby levels, then the candle itself.
A short checklist helps. Confirm the timeframe, note the trend on a higher timeframe, mark the nearest prior high and low, and check what volume shows. Then decide whether the pattern adds anything to your analysis. For formations that take longer to develop, see bullish chart patterns.
RTX5 is Orrnn's trading terminal and broker-technology product. Its Windows desktop client is in preview, and the web and mobile clients are planned. A Google Play listing for Android is published, but the mobile client has no approved release record yet; check the product-availability record and release notes before relying on any RTX5 feature. The candlestick examples on this page are illustrations and do not describe a specific RTX5 feature.
Check RTX5 product availabilityTrust and methodology
We want you to be able to identify who owns the page, inspect the evidence, understand how tools were used, and challenge anything that looks wrong or out of date.
Published under the RTX5 Editorial Team byline. It identifies the responsible publishing organization; it does not imply that a named lawyer, regulator, financial adviser, or licensed expert approved this page.
5 primary references are listed on this page with context about what each one supports. The source set was checked on .
Automation and AI may help organize research, outline a page, or edit language. They are not treated as sources, are not presented as human experts, and do not remove the publisher's responsibility for the final page.
If a statement is incomplete, unsupported, or outdated, send the exact URL, sentence, and supporting evidence through our contact route. Read the full editorial and corrections policy.
Sources were checked on 9 November 2026. They explain market rules and concepts; they do not certify RTX5 or provide individual financial advice.
A single-candle pattern is read from one candlestick, such as a doji or a hammer. Its shape describes one period: where the open and close sat relative to the high and low. A multi-candle pattern uses two or three consecutive candles, such as an engulfing pattern or a morning star, so the order and relative size of each candle matter. Multi-candle patterns need more context because the earlier candles define what the later one reacts to.
They describe past price action on the chart. Some traders use them as one input among others, but no pattern on this page is a forecast. This guide does not quote how often any pattern is followed by a particular move. Treat any shape as a prompt to check other evidence, not as a signal.
Colour is a display setting, not a fixed rule. Many platforms show a bullish candle, where the close is above the open, in green or white, and a bearish candle, where the close is below the open, in red or black. Users can often change these colours. Check the chart's settings or legend, and read the open and close rather than relying on colour alone.
No. A candle on a one-minute chart covers a different period from a candle on a daily chart, so the same shape carries different information. A hammer on a daily chart reflects a full day of trading, while the same shape on a one-minute chart reflects one minute. Check the timeframe before you read a pattern, and be cautious with patterns on very short timeframes, where noise is common.
Some traders place a stop loss with any trade idea, including one based on a candlestick pattern, because a stop limits the loss if price moves against the position. A stop is a trigger, not a fixed exit price, and a gap can fill it far from the stop. Read the stop loss guide before you rely on one.
No. Candlestick patterns are built from one to three candles, and they are read over a short run of periods. Chart patterns such as triangles and flags take longer to form, often across many periods, and they are a separate topic. The bullish chart patterns guide covers those formations.