Accountable publisher
Published under the RTX5 Editorial Team byline. It identifies the responsible publishing organization; it does not imply that a named lawyer, regulator, financial adviser, or licensed expert approved this page.
Chart types
Heikin Ashi candles are a chart type where the close averages the period's open, high, low and close, and the open averages the previous Heikin-Ashi open and close. The high and low take the highest or lowest of the raw high or low and the averaged open or close. They reduce noise, but show averaged values, not traded prices.
In brief
A heikin ashi chart keeps the candle shape but builds its values from averages and from the previous bar. Here are the formulas, a worked example from two regular candles, and what the averages cannot show.
Heikin-Ashi candles are drawn like regular candlesticks, with a body and two wicks for each period, but the values behind each candle are averages. StockCharts ChartSchool describes them as an offshoot of Japanese candlesticks and says the name combines the Japanese words for average and pace. For the basics of a regular candle, read candlestick patterns.
Neither StockCharts nor TradingView names an inventor for the method, so this guide names none.
The StockCharts ChartSchool page gives the formulas below. The TradingView help article gives matching open, close, high and low logic. In the notation, 0 is the current bar and -1 is the previous bar. Raw values are the open, high, low and close of the period.
The first bar has no previous Heikin-Ashi values, so StockCharts sets it by a separate rule. The first HA close is the average of the raw open, high, low and close. The first HA open is the average of the raw open and close. The first HA high and low equal the raw high and low. The TradingView article does not explain how the first bar is set, so this rule comes from StockCharts only.
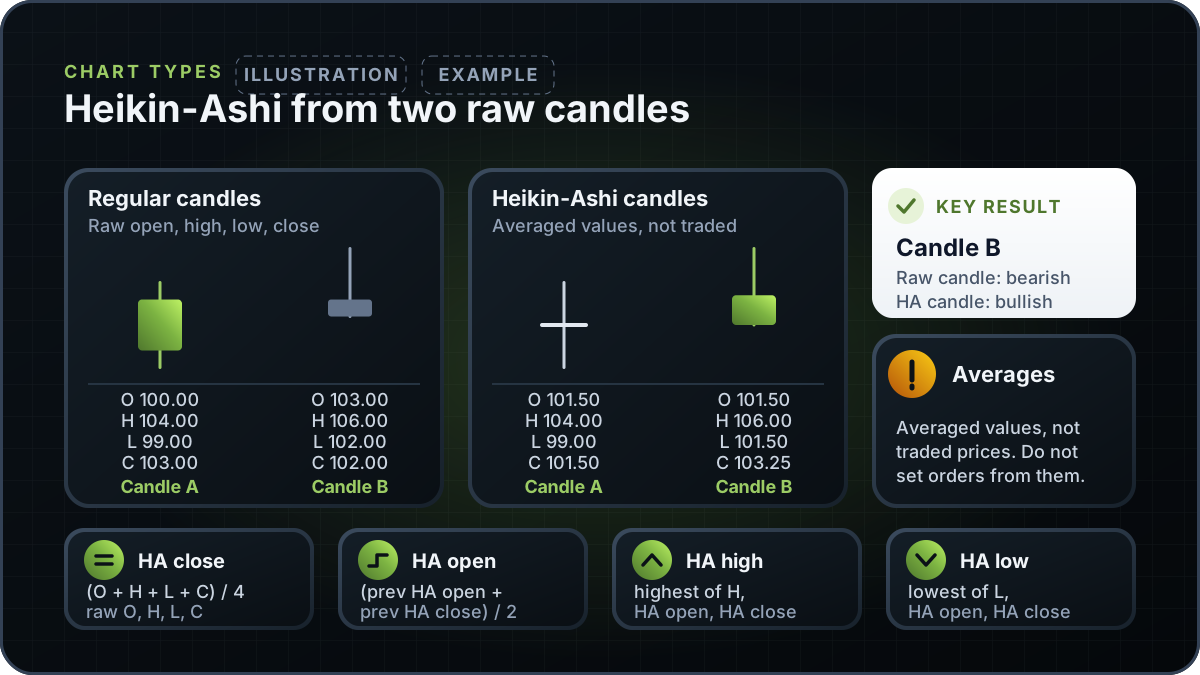
Example. The two raw candles below are invented for this guide. Candle A is bullish in raw form, with an open of 100.00 and a close of 103.00. Candle B is bearish in raw form, with an open of 103.00 and a close of 102.00. Candle A is the first bar, so it uses the starting rule.
Candle A, first bar. HA close = (100.00 + 104.00 + 99.00 + 103.00) / 4 = 406.00 / 4 = 101.50. HA open = (100.00 + 103.00) / 2 = 101.50. HA high = raw high = 104.00. HA low = raw low = 99.00. The HA open and HA close are equal, so this candle has no body.
Candle B, second bar. HA close = (103.00 + 106.00 + 102.00 + 102.00) / 4 = 413.00 / 4 = 103.25. HA open = (101.50 + 101.50) / 2 = 101.50, using candle A's HA open and HA close. HA high = max(106.00, 101.50, 103.25) = 106.00. HA low = min(102.00, 101.50, 103.25) = 101.50.
The HA low of candle B is 101.50, while its raw low is 102.00. The HA open sits below the raw low, so the lower wick reaches a value that is not a raw low in this data.
| Candle | Raw open / high / low / close | HA open | HA high | HA low | HA close | HA body |
|---|---|---|---|---|---|---|
| A (first bar) | 100.00 / 104.00 / 99.00 / 103.00 | 101.50 | 104.00 | 99.00 | 101.50 | None (open equals close) |
| B (second bar) | 103.00 / 106.00 / 102.00 / 102.00 | 101.50 | 106.00 | 101.50 | 103.25 | Bullish (close above open) |
Example only. The values are exact to two decimals. Candle B is bearish in the raw data but bullish in Heikin-Ashi form.
The example shows the main effect of the method. A bearish raw candle can become a bullish Heikin-Ashi candle, because the body is set from averages that include the previous candle. Check the raw bars before you read the direction of a Heikin-Ashi candle as the direction of the market in that period.
Read the table as a guide to the display, not a trading rule.
| Feature | Regular candlestick | Heikin-Ashi candle |
|---|---|---|
| Values drawn | The raw open, high, low and close of the period | Averaged values built from the raw data and the previous Heikin-Ashi bar |
| Traded prices | Shows the raw prices of the period | Not traded prices. TradingView says Heikin-Ashi candles show average prices, not actual prices |
| Body direction | Bullish when the close is above the open, bearish when below | The same rule applied to averaged values, so it can differ from the raw candle |
| Gaps | A jump between one close and the next open can appear as a visible gap | The open comes from the previous Heikin-Ashi bar, so a raw gap may not appear as a gap |
| Turns and lag | Each candle reflects its raw period at once | Each open averages the previous Heikin-Ashi bar, so the body can respond later to a sharp move in the raw bars |
| Wicks | Wicks reach the raw high and low | Wicks reach the highest or lowest of the averaged values and the raw high or low, so they may not match any raw bar |
The rows follow from the formulas in this guide. They describe construction, not measured market results.
Because Heikin-Ashi values depend on earlier bars, the two chart types will not match candle for candle in colour or wick length. For regular candle shapes, see candlestick patterns.
TradingView says Heikin-Ashi charts are designed to identify market trends by reducing the noise created by sharp rises and falls. Because each open uses the previous bar, a run of one colour describes a smoother averaged move than the raw candles show. That is a property of the formulas, not a signal.
StockCharts says Heikin-Ashi candles can help identify trending periods, potential reversal points and classic chart patterns, and that strings of consecutive filled or hollow candles are more likely to trend. This guide does not test them or present any Heikin-Ashi shape as a signal. A run of one colour describes averaged bars, not traded ranges, and does not predict the next bar. For raw price moves, see what is price action trading.
TradingView reads the same kind of run the other way round. It says the more similarly coloured consecutive candles there are, the more likely the current trend is coming to an end. The variant table in the next section sets out both readings.
The four formulas match between the StockCharts and TradingView references. They differ in two places: the first-bar rule, and how a run of same-coloured candles is read.
The table sets out both readings side by side. This guide does not test either one or treat either as a signal.
Neither cited reference gives a lookback length. The close uses the current raw bar. The open uses the previous Heikin-Ashi bar, which in turn depends on earlier bars, so the open depends on the whole earlier history rather than a fixed window.
Check your platform's own documentation before you compare results, because a platform may start the first bar differently.
| Reference | First-bar rule | Run of same-coloured candles | Lookback length |
|---|---|---|---|
| StockCharts ChartSchool | First close and open are averages of the raw values, first high and low equal the raw values, and the effect usually fades over seven to 10 periods. | Strings of consecutive filled or hollow candles are more likely to trend. | None stated. The open uses the previous Heikin-Ashi bar. |
| TradingView Help | Not explained in the article. | The more similarly coloured consecutive candles there are, the more likely the current trend is coming to an end. | None stated. The high and low use recent values without a stated count. |
Each row comes from the source named in its first cell. Both sources are listed under Sources. The table records what each source says and does not test either reading.
Next step: compare each Heikin-Ashi candle with its raw bar and your broker's quotes before you read any price from it.
This guide explains Heikin-Ashi candles in general and does not describe an RTX5 feature. No RTX5 release record confirms which indicators, chart types or alerts the product includes. RTX5 is Orrnn's trading terminal and broker-technology product. Its Windows desktop client is in preview, and the web and mobile clients are planned. A Google Play listing for Android is published, but the mobile client has no approved release record yet; check the product-availability record before relying on any RTX5 feature.
Check RTX5 product availabilityTrust and methodology
We want you to be able to identify who owns the page, inspect the evidence, understand how tools were used, and challenge anything that looks wrong or out of date.
Published under the RTX5 Editorial Team byline. It identifies the responsible publishing organization; it does not imply that a named lawyer, regulator, financial adviser, or licensed expert approved this page.
3 primary references are listed on this page with context about what each one supports. The source set was checked on .
Automation and AI may help organize research, outline a page, or edit language. They are not treated as sources, are not presented as human experts, and do not remove the publisher's responsibility for the final page.
If a statement is incomplete, unsupported, or outdated, send the exact URL, sentence, and supporting evidence through our contact route. Read the full editorial and corrections policy.
Sources were checked on 10 November 2026. They explain market rules and concepts; they do not certify RTX5 or provide individual financial advice.
No. A Heikin-Ashi candle's values are averaged from the raw data and the previous Heikin-Ashi bar. TradingView says these candles show average prices, not actual prices. Use the raw bars and your broker's quotes for any price you act on.
The Heikin-Ashi close is the average of the raw open, high, low and close for the same period: (Open + High + Low + Close) / 4. In the example in this guide, the raw values 100.00, 104.00, 99.00 and 103.00 give 101.50. The Heikin-Ashi open is then the average of the previous Heikin-Ashi open and close.
The StockCharts and TradingView references do not name an inventor, so this guide does not attribute the method to anyone. StockCharts calls them an offshoot of Japanese candlesticks.
The first bar has no previous Heikin-Ashi values, so it needs a starting rule. StockCharts sets the first open to the average of the raw open and close, and the first high and low to the raw high and low. Its effect usually fades within seven to 10 periods.
Not on their own. Heikin-Ashi candles are averaged values, not traded prices, so an order price or a stop level should be set from raw prices and your broker's quotes. Check how your broker and platform trigger stop orders before you rely on any level.