Accountable publisher
Published under the RTX5 Editorial Team byline. It identifies the responsible publishing organization; it does not imply that a named lawyer, regulator, financial adviser, or licensed expert approved this page.
Technical indicators
The ZigZag indicator is a chart overlay that joins swing highs and lows when price reverses by at least a set threshold, such as 5%. Smaller moves are filtered out. Because the latest leg is redrawn until a new reversal is confirmed, the ZigZag indicator repaints and is not a real-time signal.
In brief
ZigZag removes small reversals from a chart. The newest leg stays provisional until a larger reversal confirms it, so the line can change after the fact.
The ZigZag indicator draws straight lines between swing highs and swing lows. It does not draw a point for every bar. A new turning point is recorded only when price reverses by at least a set threshold, so smaller moves are left out and the chart shows fewer, larger legs. StockCharts ChartSchool describes ZigZag as a filter for smaller price movements.
The logic runs one leg at a time. While price keeps making new highs, the up leg extends. Once price falls from that high by at least the threshold, the high is confirmed as a turning point and a down leg starts from it. The same logic works in reverse at a low. For the wider background on price moves, read what is trading and the support and resistance guide.
A ZigZag indicator needs a threshold, and platforms name the setting differently. The table lists what the sources cited in this guide say. They do not agree on every detail, so the table shows the differences rather than picking one.
| Source | Setting named | Default stated | What the source says |
|---|---|---|---|
| StockCharts ChartSchool | Percentage threshold | 5%, which the article says can change with a security's price characteristics | On close-only charts, a new bar that closes at least the set percentage from the current ZigZag high or low becomes a new swing point. |
| TradingView support article | Price deviation for reversals (%) and Pivot legs | No default stated | The deviation is the minimum absolute reversal percentage, measured relative to the last displayed pivot. Pivot legs is the number of bars required to confirm a pivot point. |
| MetaTrader 5 Android help | Period, Deviation and Backstep | No default stated | Period is a minimum bar count, tied to the Deviation in pips. Deviation is the minimum pips to form a new high or low. Backstep is the minimum bars between highs or lows. |
| MQL5 article code (ZigZag analyzer) | ZZ_Depth, ZZ_Deviation and ZZ_Backstep | 12, 5 and 3 in the article's code | The article labels the inputs depth, deviation and backstep, but does not explain what each one does. |
Verified on 10 November 2026. The MetaTrader 5 settings come from its Android app help page, listed in the sources.
Because the units and names differ, a value of 5 in one platform is not the same as 5% in another. Check the inputs and their units in your own platform before you compare charts.
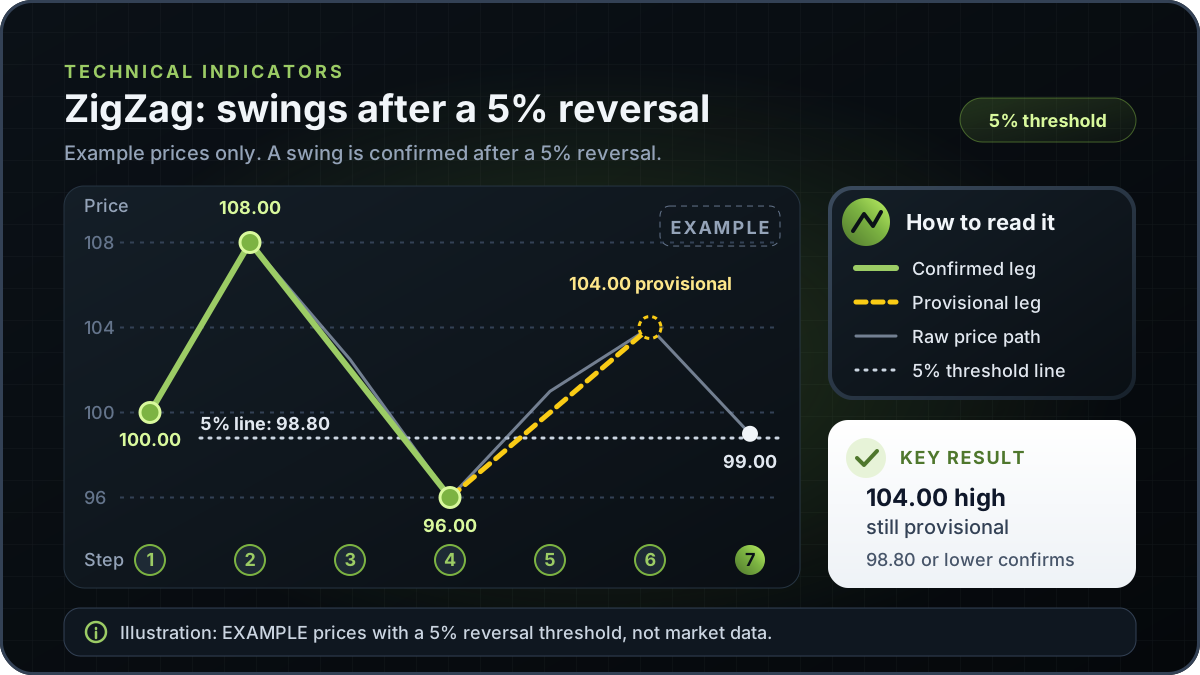
This is an Example with made-up prices, not market data. It uses a 5% threshold and follows seven price points in order. Each move is rounded to two decimal places. A move in the direction of the current leg is measured from the pivot where that leg started. A move against the current leg is measured from that leg's most recent extreme (the highest high in an up leg, the lowest low in a down leg). A reversal confirms that extreme as a turning point only when it reaches 5% of the extreme.
| Step | Price | Move from reference price | ZigZag status |
|---|---|---|---|
| 1 | 100.00 | Starting point | Pivot low at 100.00 is already marked |
| 2 | 108.00 | +8.00% from 100.00 | Up leg extends to 108.00. The high is provisional |
| 3 | 102.50 | -5.09% from 108.00 | Reversal reaches 5%. The 108.00 high is confirmed |
| 4 | 96.00 | -11.11% from 108.00 | Down leg extends to 96.00. The low is provisional |
| 5 | 101.00 | +5.21% from 96.00 | Reversal reaches 5%. The 96.00 low is confirmed |
| 6 | 104.00 | +8.33% from 96.00 | Up leg extends to 104.00. The high is provisional |
| 7 | 99.00 | -4.81% from 104.00 | Below 5%. The 104.00 high is still provisional |
Example arithmetic only. The 5% threshold is the traditional value that StockCharts describes.
At step 7 the chart shows a provisional leg from 96.00 up to 104.00. Price has fallen to 99.00, but that fall is 4.81%, which is below the threshold. A 5% reversal from 104.00 would need a price at or below 98.80, because 104.00 multiplied by 0.95 is 98.80. Until then, the 104.00 point is not a confirmed swing high, and the last leg can still change.
Had price risen to 106.00 at step 7 instead, the provisional high would have moved to 106.00 and the leg would have been redrawn to that point. A move from 96.00 to 106.00 is 10.42%. The example shows the core limit: the line visible at step 7 can differ from the line visible once a later reversal confirms the swing.
The ZigZag indicator repaints because a turning point is confirmed only by later price action. The most recent leg depends on prices that have not yet reversed by the threshold, so it can move as new bars arrive. StockCharts says the latest segment "is subject to change as new bars are added".
TradingView's support article says the indicator removes or redraws the latest line if subsequent price action invalidates its pivot points. This is the repainting limit named in the title. The older swings are fixed once confirmed. The newest leg is the part a reader most wants in real time, and it is the part least likely to stay the same.
A ZigZag line describes swings that have already been confirmed. It can show where price turned by at least the chosen threshold. It cannot show, when a leg starts, whether that leg will reach the threshold or how far it will go. For that reason this guide does not present the indicator as a timing tool, a signal or a forecast.
A finished chart can look clean and make the turns seem visible as they happened. A useful check is to ask whether the line you see would have been there at the moment you needed it. For the last leg the answer is often no. Use ZigZag to review past structure, such as counting how many swings a threshold produced over a period. Do not rely on it alone to decide an entry, a stop or an exit.
A fractals indicator marks swing points with a fixed bar pattern alone, while ZigZag adds a reversal threshold, so the two tools can mark different turns on the same chart. Both need later bars before the pivot is confirmed. Trendlines join points that you choose by hand, and Elliott wave theory uses swing structure to describe wave patterns, which is a subjective reading.
None of these methods turns a ZigZag line into a forecast. The next step is to compare the fractals rule with the threshold rule on the same chart, and note where they disagree.
This guide explains the ZigZag indicator in general and does not describe an RTX5 feature. No RTX5 release record confirms which indicators, chart types or alerts the product includes. Its Windows desktop client is in preview, and the web and mobile clients are planned. A Google Play listing for Android is published, but the mobile client has no approved release record yet; check the product-availability record before relying on any RTX5 feature.
Check RTX5 product availabilityTrust and methodology
We want you to be able to identify who owns the page, inspect the evidence, understand how tools were used, and challenge anything that looks wrong or out of date.
Published under the RTX5 Editorial Team byline. It identifies the responsible publishing organization; it does not imply that a named lawyer, regulator, financial adviser, or licensed expert approved this page.
5 primary references are listed on this page with context about what each one supports. The source set was checked on .
Automation and AI may help organize research, outline a page, or edit language. They are not treated as sources, are not presented as human experts, and do not remove the publisher's responsibility for the final page.
If a statement is incomplete, unsupported, or outdated, send the exact URL, sentence, and supporting evidence through our contact route. Read the full editorial and corrections policy.
Sources were checked on 10 November 2026. They explain market rules and concepts; they do not certify RTX5 or provide individual financial advice.
The ZigZag indicator is a chart overlay that connects swing highs and lows when price reverses by at least a set threshold, such as 5%. Smaller moves are filtered out, so the chart shows fewer, larger legs. It describes swings that have already been confirmed. It does not forecast the next move, and its newest leg can change as new bars arrive.
A turning point is confirmed only when later price action reverses by the threshold. Until then, the latest leg is provisional. As new bars arrive, that leg can extend, shorten or disappear, and the chart is redrawn. StockCharts describes the latest segment as subject to change, and TradingView says the latest line can be redrawn when later price invalidates the pivot.
No. This guide does not present ZigZag as a buy or sell signal, a timing tool or a forecast. It marks past swings that a set reversal confirmed, and the latest leg is not final. A confirmed low shows where price turned in the past. It does not show what price will do after that point.
It depends on the platform and the source. StockCharts ChartSchool describes 5% as the traditional threshold and the default parameter, which can change with a security's price characteristics; its charts can also choose a percentage for each security automatically. The TradingView support article states no default for its deviation setting, and the MetaTrader 5 Android help states none for Period, Deviation or Backstep. An MQL5 article's code declares ZZ_Deviation as 5, but that is a code value, not a platform default.
ZigZag uses a reversal threshold: a turn counts when price reverses by the set amount, and some versions also need a bar count to confirm a pivot. A fractal uses a fixed bar pattern only, so the two can mark different turns on the same chart. Both need later bars to confirm a pivot, and neither shows the price that comes next. The fractals indicator guide explains its own rule.
Confirmed turning points can be read as past reference prices, and some traders review them that way. The indicator does not mark support or resistance levels as such. A line on a chart is not a proven level, so read the support and resistance guide before you use past turns as reference points.