Accountable publisher
Published under the RTX5 Editorial Team byline. It identifies the responsible publishing organization; it does not imply that a named lawyer, regulator, financial adviser, or licensed expert approved this page.
Technical indicators
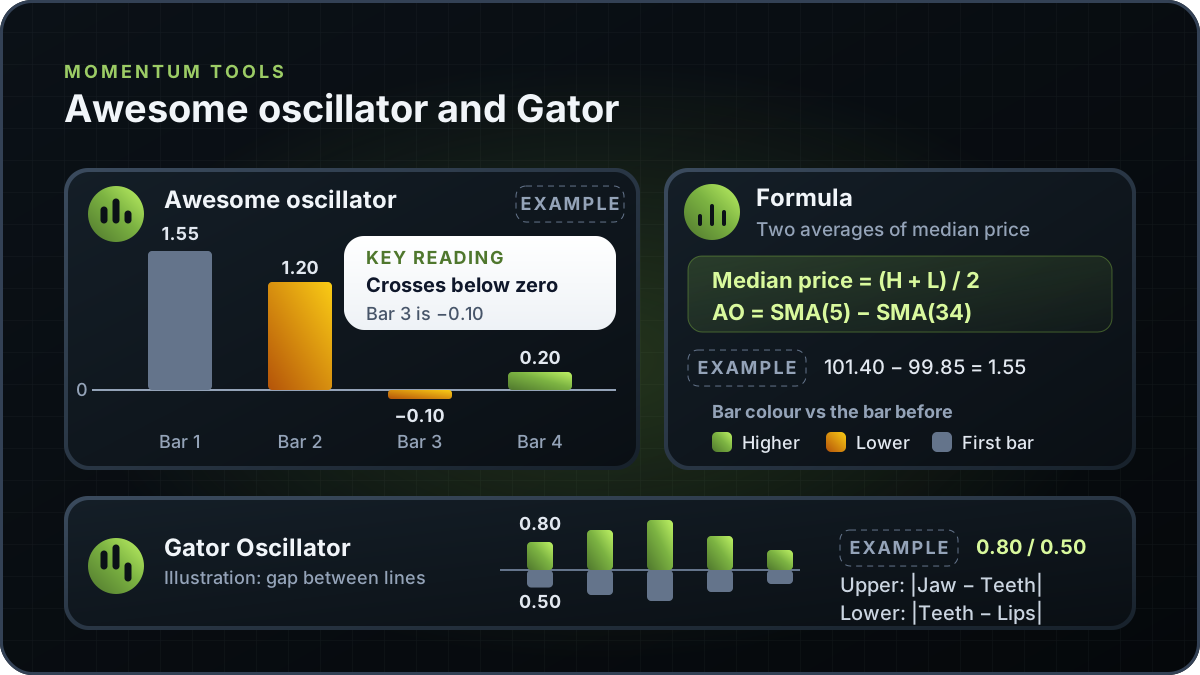
The awesome oscillator is a momentum histogram attributed to Bill Williams. It is the 5-period simple moving average of the median price, (high + low) / 2, minus the 34-period simple moving average of the same price. Positive bars mean the short average is above the long one. It describes past bars and makes no forecast.
In brief
The awesome oscillator is one subtraction of two averages of median price. Here is its formula, a worked example from assumed averages, how the zero-line and saucer readings are described, and how the Gator Oscillator is built from the Alligator lines.
The awesome oscillator compares two simple moving averages of the same input, the median price of each bar. The MetaTrader 5 help and the TradingView support article both attribute it to Bill Williams; neither gives a publication year. Both cited references describe the same two averages. Because the inputs are midpoints, each bar's high and low affect the reading, not only its close.
A positive value means the 5-period average is above the 34-period average. A value of zero means the two averages are equal. The indicator does not show how far price will move, or whether an instrument is cheap or expensive. For a separate momentum indicator, see what is MACD.
Both cited sources use simple averages of midpoints, not closes. The periods count bars, so the timeframe changes the time span each reading covers.
This example uses assumed values, not market data, and starts from the two averages.
Example, median price: a bar with a high of 102.00 and a low of 99.00 has a median price of (102.00 + 99.00) / 2, which is 100.50.
| Bar | 5-period SMA | 34-period SMA | Awesome oscillator | Bar colour |
|---|---|---|---|---|
| 1 | 101.40 | 99.85 | 1.55 | No earlier bar to compare with |
| 2 | 101.10 | 99.90 | 1.20 | Lower than 1.55: amber in the diagram, red on TradingView |
| 3 | 99.90 | 100.00 | -0.10 | Lower than 1.20, below zero: amber in the diagram, red on TradingView |
| 4 | 100.20 | 100.00 | 0.20 | Green: higher than -0.10, above zero |
Example only. Each oscillator value is the 5-period SMA minus the 34-period SMA: 101.40 - 99.85 = 1.55; 101.10 - 99.90 = 1.20; 99.90 - 100.00 = -0.10; 100.20 - 100.00 = 0.20.
Bar 3 is the first bar below zero, so the cross falls between bars 2 and 3, and bar 4 crosses back above zero. Each cross only records how the 5-period average moved relative to the 34-period average. It says nothing about the next bar.
The MetaTrader 5 help and TradingView both describe a zero-line cross, a saucer and twin peaks, and each gives buy-side and sell-side forms. The saucer and twin-peak rules differ between them, so each source has its own row. The last column is this page's reading, not a source claim.
| Reading | Description in the cited sources | What it does not prove |
|---|---|---|
| Zero-line cross | MetaTrader 5, buy: two columns are enough, the first below zero and the second crossing it. Sell: the first column is over zero and the second is under it. TradingView: the AO crosses above or below the zero line. | That the price will rise or that the move will last. A cross shows only that the 5-period average moved above or below the 34-period average. |
| Saucer, MetaTrader 5 | Buy: all columns above zero. The second column is lower than the first and red, and the third is higher than the second and green. At least three columns are needed. Sell: the saucer signal is reversed and below zero. | That a move will follow, or that the pattern will hold after the bar closes. |
| Saucer, TradingView | Bullish, with the AO above zero: two consecutive red bars, the second lower than the first, followed by a green bar. Bearish, with the AO below zero: two consecutive green bars, the second higher than the first, followed by a red bar. | As for the MetaTrader 5 saucer. |
| Twin peaks, MetaTrader 5 | Buy: can form below zero. The bar chart stays below zero between the two peaks, and each new peak is higher, closer to zero, than the one before. If the bar chart crosses zero between the peaks, the buy signal does not function. Sell: the signal is above zero and reversed. | That the second trough marks the low of a move. Two troughs can line up while price keeps falling. |
| Twin peaks, TradingView | Bullish, with the AO below zero: two peaks below zero, the second higher than the first and followed by a green bar, and the trough between them stays below zero. Bearish, with the AO above zero: two peaks above zero, the second lower than the first and followed by a red bar, and the trough between them stays above zero. | That the second peak marks the end of a move. Two peaks can line up while price keeps moving the same way. |
Sources: MetaTrader 5 Awesome Oscillator help and TradingView support article, both checked 10 November 2026. The saucer and twin-peak rules differ between the two sources, so read the exact definition in your platform.
Both cited sources give the same periods and price basis. Only TradingView states a general bar-colour rule. The table sets them side by side.
| Element | MetaTrader 5 help | TradingView support | This page |
|---|---|---|---|
| Price basis | Median price, (high + low) / 2 | Midpoints, (high + low) / 2 | Median price, (high + low) / 2 |
| Periods | 5 and 34 | 5 and 34 | 5 and 34 |
| Average type | Simple moving average | Simple moving average | Simple moving average |
| Bar colour | Colours given only in the saucer example: a lower bar coloured red, then a higher bar coloured green | Green when higher than the previous bar, red when lower | TradingView's general rule |
| Gator histograms | Absolute differences between Alligator lines | Not covered in the cited article | Construction only, in the Gator section |
Verified on 10 November 2026. Platforms that calculate the awesome oscillator from closing prices, or use other periods, are outside these two sources, and their readings will differ.
The Gator Oscillator is two histograms built from three lines of the Alligator indicator: the Jaw, the Teeth and the Lips, as the MetaTrader 5 help names them. The Alligator periods and shifts are listed on the MetaTrader 5 Alligator page. This section describes the calculation, not a setup or a trading rule.
The lower histogram is drawn with a minus sign because the chart is drawn top-down. Both histograms use absolute values, so the Gator shows distance between the lines, not direction.
Example, construction only: assume the Jaw is 100.00, the Teeth 99.20 and the Lips 98.70, all aligned to one bar. The upper histogram is |100.00 - 99.20|, which is 0.80. The lower is |99.20 - 98.70|, which is 0.50, drawn as -0.50.
The input should be the median price, (high + low) / 2, not the close. A close-based chart shows different values.
Check the 5 and 34 settings, or the values you set yourself, and note the timeframe.
On TradingView's rule, a bar should be green when it is higher than the bar before it and red when it is lower. A mismatch can come from a different setting, input or colour rule.
A momentum reading is easier to judge alongside price and volume. See volume in trading and what is price action trading.
This guide explains the awesome oscillator in general and does not describe an RTX5 feature. No RTX5 release record confirms which indicators, chart types or alerts the product includes. Its Windows desktop client is in preview, and the web and mobile clients are planned. A Google Play listing for Android is published, but the mobile client has no approved release record yet; check the product-availability record before relying on any RTX5 feature.
Check RTX5 product availabilityTrust and methodology
We want you to be able to identify who owns the page, inspect the evidence, understand how tools were used, and challenge anything that looks wrong or out of date.
Published under the RTX5 Editorial Team byline. It identifies the responsible publishing organization; it does not imply that a named lawyer, regulator, financial adviser, or licensed expert approved this page.
5 primary references are listed on this page with context about what each one supports. The source set was checked on .
Automation and AI may help organize research, outline a page, or edit language. They are not treated as sources, are not presented as human experts, and do not remove the publisher's responsibility for the final page.
If a statement is incomplete, unsupported, or outdated, send the exact URL, sentence, and supporting evidence through our contact route. Read the full editorial and corrections policy.
Sources were checked on 10 November 2026. They explain market rules and concepts; they do not certify RTX5 or provide individual financial advice.
The awesome oscillator is a momentum histogram attributed to Bill Williams. It shows the difference between a 5-period and a 34-period simple moving average of the median price of each bar. A positive value means the short average is above the long average. It describes past bars and forecasts nothing.
The MetaTrader 5 help and the TradingView support article both use a 5-period and a 34-period simple moving average of the median price, (high + low) / 2. A platform that uses a different input or different periods will show different values, so check the settings before comparing charts.
The awesome oscillator is one histogram of two averages of the median price. The Gator Oscillator is two histograms built from the Alligator lines: the upper one is the absolute difference between the Jaw and the Teeth, and the lower one is the absolute difference between the Teeth and the Lips. The Gator shows distance between the lines, not their direction.
No. This page explains how a zero-line cross is described and does not give trading advice. A cross shows that the 5-period average moved above or below the 34-period average. The TradingView article uses bullish and bearish wording, but neither source shows that price will follow. Entry, exit and position size belong in a plan built around your own risk.
No. The awesome oscillator uses simple averages of the median price over 5 and 34 periods. MACD has its own inputs and construction, so the two readings should not be compared bar for bar.