Accountable publisher
Published under the RTX5 Editorial Team byline. It identifies the responsible publishing organization; it does not imply that a named lawyer, regulator, financial adviser, or licensed expert approved this page.
Trading glossary
Volume in trading is the number of shares or contracts traded in a given period, such as a day or a minute. It counts how much changed hands, not whether the price will rise or fall. Volume analysis is a separate method that reads volume alongside price.
In brief
Volume counts activity, and volume analysis is a method that reads that count alongside price. Here is what each means, where the figure comes from in each market, and what volume cannot tell you.
Volume in trading is the count of how much changed hands in a period. For a stock it is the number of shares traded, and for a futures contract it is the number of contracts traded. Nasdaq's glossary describes stock volume as the daily number of shares of a security that change hands between a buyer and a seller. The CFTC's glossary describes futures volume as the number of contracts traded during a specified period of time.
A volume bar on a chart shows that count for one bar, whether the bar covers a day, an hour or a minute. A tall bar means more units traded in that bar than a short one. The bar does not show whether the price rose or fell, whether buyers or sellers were more active, or whether the move will continue. For the chart context, see what is price action trading.
Volume analysis is a method. It reads the volume count alongside price to ask whether trading activity supports a price move. Volume is the raw number; volume analysis is the set of conventions traders apply to that number. The two terms are often used loosely, so it helps to separate them when you read a guide, a platform help page or a course.
| Aspect | Volume in trading | Volume analysis |
|---|---|---|
| What it is | A count of shares or contracts traded in a period | A method that reads volume alongside price |
| Question it answers | How much trading took place? | Does trading activity support or contradict the price move? |
| Common forms | Daily volume, intraday bar volume, tick volume on some forex platforms | Confirmation, divergence, relative volume, on-balance volume, volume profile |
| Does it predict price? | No. It describes activity only. | No. It describes patterns and conventions and does not prove a move will continue. |
| Main limit | The figure depends on the market and the data source | The result depends on the rules chosen and the price data it is paired with |
Definitions of volume: Nasdaq glossary and CFTC glossary, both checked on 9 November 2026. The analysis methods are trader conventions, not official definitions.
The table is a summary, not a rulebook. Each method in the right-hand column has several versions, and the settings traders use vary by market and timeframe.
The methods below are trader conventions. None of them is an official definition, and none is a forecast. Each works better as a question about the chart than as an answer.
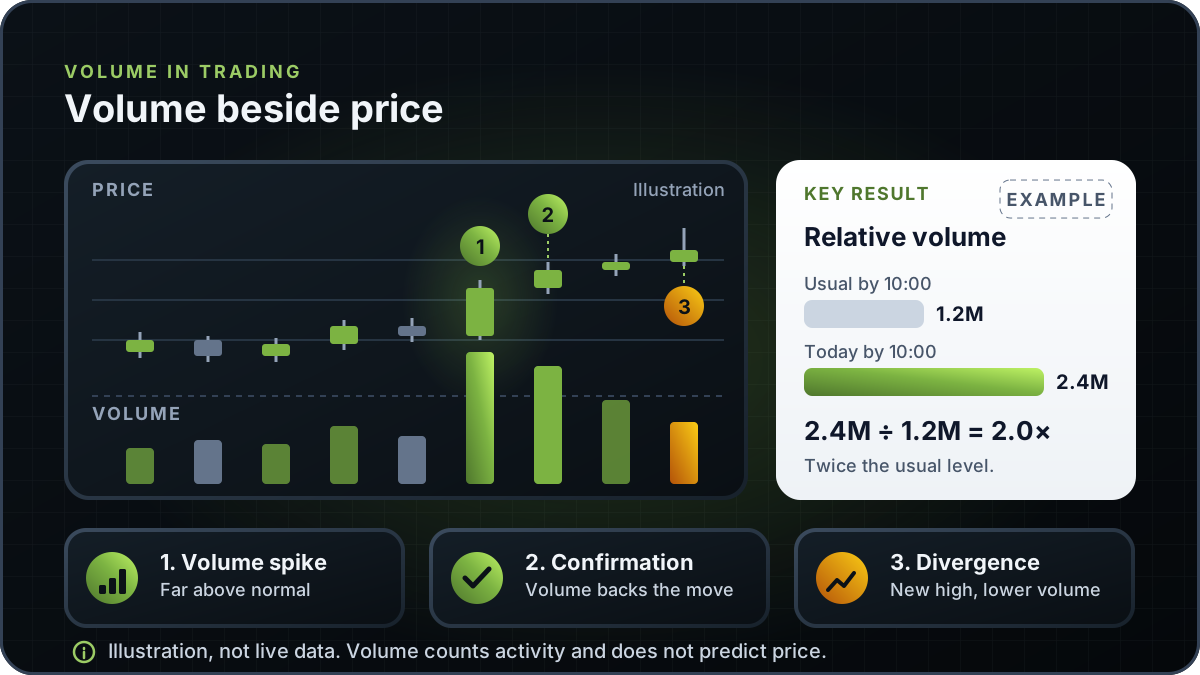
Example, relative volume: a stock usually trades 1.2 million shares by 10:00 on a normal day. Today it has traded 2.4 million shares by the same time. Relative volume is 2.4 divided by 1.2, which equals 2.0, so today's activity is twice its usual level at that point. That shows the activity was unusual. It does not show that the price will keep rising.
Example, on-balance volume: day 1 closes up on 1.0 million shares, so the running total is 1.0 million. Day 2 closes down on 0.4 million shares, so the total falls by 0.4 million to 0.6 million. Both figures are illustrative, not data from a real instrument.
The volume figure depends on the market. Stocks and futures trade on organised exchanges or through reporting venues, so each has a published count of what traded. Spot forex is different. It trades over the counter, between banks, brokers and clients, and no single exchange reports all of it.
The Bank for International Settlements' 2025 Triennial Central Bank Survey covers over-the-counter foreign exchange markets. It reports global FX turnover of US$9.6 trillion per day in April 2025. That is a survey measure of market size, not a volume figure that any one broker or exchange publishes for the pair you trade.
Tick volume is what many forex platforms show. It counts price updates on the platform's own feed during a bar, which makes it a proxy for activity. It is not the number of units traded, and it can differ between brokers and feeds. Use it as a relative guide on one platform, not as exchange volume.
Futures volume and open interest are different measures. Volume counts the contracts traded in a period. The CFTC glossary defines open interest as the total number of futures contracts long or short in a delivery month or market that have not yet been liquidated by an offsetting transaction or fulfilled by delivery. Reading the two together is common practice, but they describe different things.
Volume does not predict price on its own. A high-volume day can be a sell-off, a short-covering rally, an index event or a day of news, and each has a different meaning. A low-volume day can be a quiet session, a thin holiday market or a pause. The count alone cannot separate these cases.
For the next step, read level 2 trading to see how order-book depth differs from a count of completed trades. For how market data is described on RTX5, see market data.
RTX5 is Orrnn's trading terminal and broker-technology product. Its Windows desktop client is in preview, and the web and mobile clients are planned. A Google Play listing for Android is published, but the mobile client has no approved release record yet; check the product-availability record before relying on any RTX5 feature. The volume examples on this page are illustrative and do not describe an RTX5 feature.
Check RTX5 product availabilityTrust and methodology
We want you to be able to identify who owns the page, inspect the evidence, understand how tools were used, and challenge anything that looks wrong or out of date.
Published under the RTX5 Editorial Team byline. It identifies the responsible publishing organization; it does not imply that a named lawyer, regulator, financial adviser, or licensed expert approved this page.
4 primary references are listed on this page with context about what each one supports. The source set was checked on .
Automation and AI may help organize research, outline a page, or edit language. They are not treated as sources, are not presented as human experts, and do not remove the publisher's responsibility for the final page.
If a statement is incomplete, unsupported, or outdated, send the exact URL, sentence, and supporting evidence through our contact route. Read the full editorial and corrections policy.
Sources were checked on 9 November 2026. They explain market rules and concepts; they do not certify RTX5 or provide individual financial advice.
Volume in trading is the number of shares or contracts traded in a given period. A volume bar on a daily chart shows how many units traded that day. Volume counts activity only. It does not show whether buyers or sellers were more aggressive, and it does not predict the next price move.
Volume analysis is a way of reading volume alongside price. Traders use it to ask whether activity supports a move, for example whether a breakout came with more volume than usual. Methods include confirmation, divergence, relative volume, on-balance volume and volume profile. These are conventions, and none of them proves that a move will continue.
Spot forex has no central exchange and no single official volume figure. Trading happens over the counter between banks, brokers and clients. The BIS Triennial Survey measures FX turnover across these over-the-counter markets. Many platforms show tick volume, which counts price updates on their own feed. That is a proxy for activity, not the number of units traded.
No. High volume means heavy trading, which can happen in a sell-off as easily as a rally, at a turning point, or around news. Volume can add context to a move, but it does not show direction. A high-volume bar can be followed by a fall, so check volume against price structure and your own risk limits.
Volume counts the contracts traded during a period. Open interest counts the futures contracts that are still open, long or short, and have not been closed by an offsetting trade or fulfilled by delivery. The CFTC glossary defines both. Volume measures activity over a period, while open interest is a running total of open positions.
The exchange, your broker or a data vendor usually publishes volume for listed instruments. Figures can differ by source and by the way each source counts trades. Check the source's definition before you compare numbers, and check the exchange's official calendar for trading hours.