Accountable publisher
Published under the RTX5 Editorial Team byline. It identifies the responsible publishing organization; it does not imply that a named lawyer, regulator, financial adviser, or licensed expert approved this page.
Technical indicators
Chaikin money flow, or CMF, is a volume-weighted indicator developed by Marc Chaikin. It adds up money flow volume over a set number of bars and divides by total volume, giving a value between -1 and +1. Readings above zero describe buying pressure, and readings below zero describe selling pressure.
In brief
Chaikin money flow weights each bar's volume by where the close sits inside the bar's range. Here is the formula, a three-bar worked example with exact arithmetic, the default settings the sources give, and the limits of reading it.
Chaikin money flow is a volume indicator. It asks a simple question of each bar: did the close sit in the upper or lower part of the bar's range, and how much volume traded in that bar? A close near the high pushes the reading up, and a close near the low pushes it down, in proportion to volume. The reading then covers a window of bars.
For the wider background on volume, see volume in trading.
Marc Chaikin's formula is set out the same way by StockCharts and TradingView. Both give the money flow multiplier and money flow volume below, then sum over a look-back window.
Because the result is a ratio of two sums, it is bounded. StockCharts adds that it rarely reaches the extremes of -1 and +1.
The multiplier compares the close with the middle of the bar. Rewritten, the numerator is 2 x Close - High - Low, so the multiplier is positive when the close is above the midpoint of the high-low range, zero at the midpoint, and negative below it. A close at the high gives +1. A close at the low gives -1.
The divisor is the bar's full range, High minus Low. A bar with no range, where high and low are equal, cannot be scored because the division has no value. The sources checked for this page do not state how each platform handles such a bar, so check your chart's documentation.
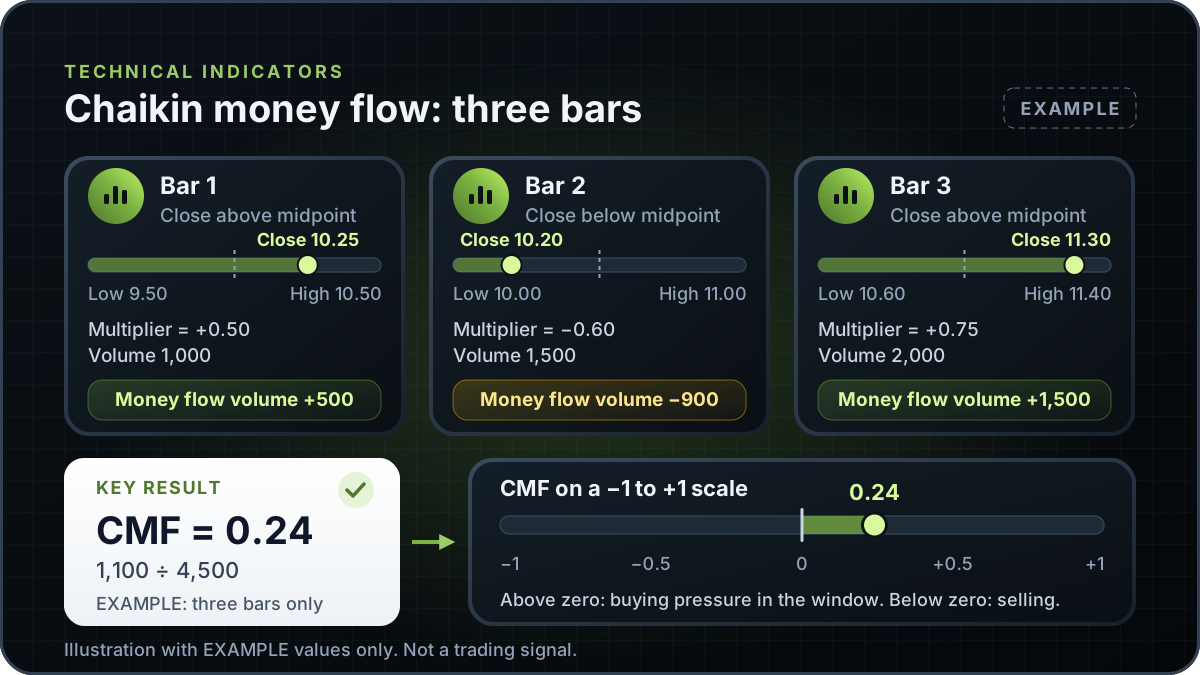
This is an EXAMPLE with assumed prices and volumes, not market data. Three bars are used because the arithmetic is easy to follow. The standard window is 20 or 21 bars, so this three-bar total is for illustration only.
Bar 1: high 10.50, low 9.50, close 10.25, volume 1,000. The range is 1.00. The multiplier is ((10.25 - 9.50) - (10.50 - 10.25)) / 1.00 = (0.75 - 0.25) / 1.00 = 0.50. Money flow volume is 0.50 x 1,000 = 500.
Bar 2: high 11.00, low 10.00, close 10.20, volume 1,500. The range is 1.00. The multiplier is ((10.20 - 10.00) - (11.00 - 10.20)) / 1.00 = (0.20 - 0.80) / 1.00 = -0.60. Money flow volume is -0.60 x 1,500 = -900.
Bar 3: high 11.40, low 10.60, close 11.30, volume 2,000. The range is 0.80. The multiplier is ((11.30 - 10.60) - (11.40 - 11.30)) / 0.80 = (0.70 - 0.10) / 0.80 = 0.75. Money flow volume is 0.75 x 2,000 = 1,500.
| Bar | High | Low | Close | Volume | Multiplier | Money flow volume |
|---|---|---|---|---|---|---|
| 1 | 10.50 | 9.50 | 10.25 | 1,000 | +0.50 | +500 |
| 2 | 11.00 | 10.00 | 10.20 | 1,500 | -0.60 | -900 |
| 3 | 11.40 | 10.60 | 11.30 | 2,000 | +0.75 | +1,500 |
| Total | 4,500 | +1,100 |
EXAMPLE only. CMF = 1,100 / 4,500 = 0.2444, shown as 0.24. A three-bar window is for illustration, not a standard setting.
The sum of money flow volume is +1,100 and the sum of volume is 4,500, so the three-bar CMF is 0.24 when rounded to two decimal places. In this EXAMPLE the value is above zero. The StockCharts convention would describe that as buying pressure over these three bars. StockCharts suggests thresholds of +0.05 and -0.05 around zero, shown on a 20-day example chart. A three-bar example is too short to apply them meaningfully.
Now change one input. Suppose bar 3 had closed at its low of 10.60 instead. Its multiplier would be -1 and its money flow volume -2,000. The total would be 500 - 900 - 2,000 = -2,400, and the CMF would be -2,400 / 4,500 = -0.53. The same volume now sits on the selling side. This variant is also an EXAMPLE, and it shows why the close location matters as much as the volume.
The sources do not agree on every detail, so the table sets them side by side rather than choosing one. Where a source gives a range or a rule, the row quotes it. The third row is a different indicator and is included only to prevent confusion.
| Source | Period | Range stated | Zero-line statement |
|---|---|---|---|
| StockCharts ChartSchool, Chaikin Money Flow (Marc Chaikin) | 20 in the published example; SharpCharts default 20; text says typically 20 or 21 | Between -1 and +1, rarely at the extremes; typically -0.50 to +0.50 | Positive territory indicates buying pressure, negative indicates selling; thresholds of +0.05 and -0.05 around zero suggested, shown on a 20-day example chart |
| TradingView support, Chaikin Money Flow (CMF) | Text says most popular settings are 20 or 21 days; the calculation example uses 21 | Stated as between 1 and -1 | A cross of the zero line can indicate an impending trend reversal |
| MetaTrader 5 help, Chaikin Oscillator (a different indicator) | EMA(A/D, 3) minus EMA(A/D, 10) | Not stated as a CMF range | Not a CMF. Built on the accumulation/distribution line, so it is not interchangeable with CMF |
Sources checked on 10 November 2026. The TradingView zero-line statement is the source's own claim, and this page does not adopt it as a forecast.
Write the period down with any reading you record, because a 20-bar and a 21-bar CMF will not match. Your platform may default to another value, so confirm the setting on your chart. The MACD guide makes the same point about settings.
The table lists the readings educational sources describe, with the limit that matters most for each.
| Reading | Common description | What it does not prove |
|---|---|---|
| CMF above zero | Buying pressure, per StockCharts | That the price will rise. It describes the bars already in the window. |
| CMF below zero | Selling pressure, per StockCharts | That the price will fall or that a downtrend will continue. |
| CMF crosses above or below zero | A cross can show a shift in pressure; TradingView describes a cross as a possible impending trend reversal | That a reversal will occur. A cross is a change in the sign of a ratio, and crosses can repeat inside a range. |
| CMF held near +0.50 or -0.50 | StockCharts says the oscillator typically sits between -0.50 and +0.50 | That the price is overbought or oversold. The range describes volume and close location, not price value. |
Source for the descriptions: StockCharts ChartSchool and TradingView support. The third column is this page's reading and is not from either source.
Three limits matter most, and each is a reason to check your data before you use a reading.
These limits define what the indicator can show. For volume read by price level rather than by bar, see volume profile vs market profile.
This guide explains Chaikin money flow in general and does not describe an RTX5 feature. No RTX5 release record confirms which indicators, chart types or alerts the product includes. Its Windows desktop client is in preview, and the web and mobile clients are planned. A Google Play listing for Android is published, but the mobile client has no approved release record yet; check the product-availability record before relying on any RTX5 feature.
Check RTX5 product availabilityTrust and methodology
We want you to be able to identify who owns the page, inspect the evidence, understand how tools were used, and challenge anything that looks wrong or out of date.
Published under the RTX5 Editorial Team byline. It identifies the responsible publishing organization; it does not imply that a named lawyer, regulator, financial adviser, or licensed expert approved this page.
4 primary references are listed on this page with context about what each one supports. The source set was checked on .
Automation and AI may help organize research, outline a page, or edit language. They are not treated as sources, are not presented as human experts, and do not remove the publisher's responsibility for the final page.
If a statement is incomplete, unsupported, or outdated, send the exact URL, sentence, and supporting evidence through our contact route. Read the full editorial and corrections policy.
Sources were checked on 10 November 2026. They explain market rules and concepts; they do not certify RTX5 or provide individual financial advice.
CMF divides the sum of money flow volume over a window by the sum of volume. The Chaikin oscillator, as MetaTrader 5 describes it, is a 3-period EMA minus a 10-period EMA of the accumulation/distribution line. They are different calculations, so check the formula behind any chart label.
StockCharts gives 20 as its default and says the typical look-back is 20 or 21 bars. TradingView says the most popular settings are 20 or 21 days. The period you choose changes the reading, so use the same setting when you compare readings and record the value you used.
No. A positive CMF describes buying pressure in the bars inside the window, using the close's position within each range and each bar's volume. It does not forecast the next price move. TradingView describes a zero-line cross as a possible trend reversal, but that is the source's claim and does not make the cross a reliable signal.
The multiplier divides by High minus Low, so on a bar where the high equals the low the divisor is zero and the formula gives no value for that bar. The sources checked for this page, StockCharts and TradingView, do not state a rule for this case or how each platform handles it. Check your chart's documentation before reading CMF over a window that contains such a bar, and see the limits section of this guide for the other input problems.