Accountable publisher
Published under the RTX5 Editorial Team byline. It identifies the responsible publishing organization; it does not imply that a named lawyer, regulator, financial adviser, or licensed expert approved this page.
Chart analysis
Volume profile is a histogram of the volume traded at each price over a chosen period, with a point of control and a value area. Market Profile, developed by J. Peter Steidlmayer, uses time-price opportunities (TPOs) instead: one mark per time period at each price. Both usually set the value area at 70%.
In brief
Both tools show where price was accepted over a chosen window. Volume profile weights each price by the volume traded there, while Market Profile counts how many time periods visited it.
A volume profile, sometimes called volume by price, splits a chosen period into price levels and totals the volume traded at each one. The result is a horizontal histogram: a long bar marks a price where much traded, a short bar a price where little traded. It does not show the order of those trades or who placed them.
TradingView's support article defines the point of control as the price with the highest traded volume and builds the value area outward from it. It compares the next row above with the next row below, takes the larger, and includes it "if adding it does not exceed the remaining target volume". Otherwise: "If it would exceed the target, stop". For the basic volume count, read volume in trading.
Market Profile, often shown as a TPO chart, does not weight prices by volume. It divides the profile period into equal time blocks, labels each block with a letter (A to Z, then a to z), and places that letter at every price traded during the block. It answers how many time periods traded at each price, not how much traded there.
TradingView's support article on time-price opportunity charts gives a default block of 30 minutes, and a value area that holds 70% of the TPOs by default. Its TPO indicator article credits J. Peter Steidlmayer with formulating the concept at the Chicago Board of Trade (CBOT) in the 1980s.
Its value-area procedure also starts at the point of control and adds the neighbouring row with more blocks, but it "Repeats steps four-six until the total number of VA blocks reaches the target". The last row added can therefore take the total past the target.
Both tools are built from the same price data but count different things, so their point of control can match while their sizes do not.
| Aspect | Volume profile | Market Profile (TPO) |
|---|---|---|
| What is counted | Volume traded at each price level | Time blocks (TPOs) in which each price traded |
| Data needed | Traded volume for the period, in the volume type your platform uses | Time-stamped prices and a chosen block size, usually 30 minutes |
| Point of control | The price level with the highest traded volume | The price level with the most TPOs |
| Value area | The band around the point of control holding a set share of volume, often 70% | The band around the point of control holding a set share of TPOs, default 70% |
| Typical use | Showing where volume concentrated in any chosen window of a chart | Showing the shape of a session by time spent at each price; TradingView says it has gained widespread acceptance in futures and commodity markets and is now widely used across all sectors |
| Main limits | Depends on the volume type your platform uses, as set out in the defaults table | Ignores how much volume traded; the shape changes with block size and period |
The first four rows follow the TradingView articles in the sources; the futures and commodities remark is from the TPO chart article. The other typical-use and limits entries describe general practice, not official definitions.
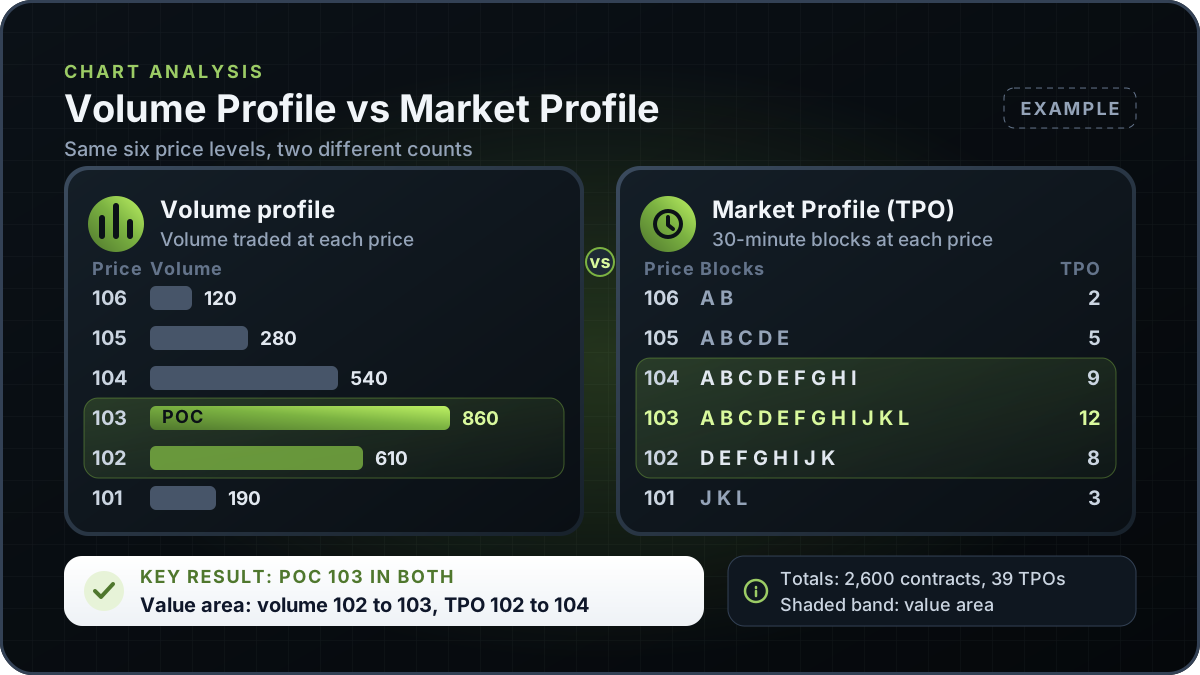
This is an Example with invented numbers, not market data. One profile period covers six price levels, 101 to 106, and both profiles use the same levels.
| Price level | Volume (contracts) | TPO count (30-minute blocks) |
|---|---|---|
| 106 | 120 | 2 |
| 105 | 280 | 5 |
| 104 | 540 | 9 |
| 103 | 860 | 12 |
| 102 | 610 | 8 |
| 101 | 190 | 3 |
| Total | 2,600 | 39 |
Example figures only. The 30-minute block is the TradingView TPO default.
Volume profile (TradingView volume procedure). The point of control is 103, with 860 of 2,600 contracts. The 70% target is 0.70 x 2,600 = 1,820, so 960 remain after 103. Of 104 (540) and 102 (610), 102 is larger and fits, leaving 350. Next, 104 (540) beats 101 (190) but would exceed 350, so the value area is complete: 102 to 103, holding 1,470 contracts, or 56.5% of the total.
Market Profile (TradingView TPO procedure). The point of control is 103, with 12 of 39 TPOs. The target is 0.70 x 39 = 27.3. Of 104 (9) and 102 (8), 104 is added, giving 21. Of 105 (5) and 102 (8), 102 is added, giving 29, which reaches the target. The value area is 102 to 104, holding 29 TPOs, or 74.4%.
Reading the two results. The point of control is 103 in both, but the value areas differ, partly because of the stop rules: the volume procedure stops before overshooting, so it ends below 70%, while the TPO procedure ends above. With only six rows each step is large. The sizes are not comparable either: 860 contracts against 12 half-hour blocks. This example assumes a period of 12 thirty-minute blocks (A to L, 6 hours), with price trading at 103 in every block. The 39 TPOs count each block at each price it traded, so they are not 39 blocks of time. Neither result shows what price will do next.
Defaults differ by platform and source. The table records each with its source, and shows both where sources differ.
| Setting | Default or variant | Source |
|---|---|---|
| Value area, volume profile | 70% is typical; the article says the percentage is at the trader's discretion | TradingView Volume Profile support article |
| Value area, TPO | 70% default, set in the indicator inputs | TradingView TPO chart and TPO indicator articles |
| Value area stop rule | Volume profile: stop before a row that would exceed the remaining target. TPO: keep adding rows until the target is reached | TradingView Volume Profile and TPO indicator articles |
| TPO block size | 30 minutes default; 5, 10, 15 or 30 minutes, or 1, 2 or 4 hours | TradingView TPO support article |
| Profile period | One day by default; can run for days, weeks or months | TradingView TPO support article |
| Volume by Price (StockCharts) | 12 bars by default, based on closing prices; highs and lows are omitted | StockCharts ChartSchool Volume by Price |
| Volume type | Trade volume for stocks; tick volume for indices, forex and crypto CFDs on TradingView | TradingView Volume Profile support article |
StockCharts Volume by Price is a different tool from a TradingView volume profile, so its 12 bars will not match other platforms. Two charts can both show a 70% value area and still differ in row count, block size, volume type and stop rule.
Volume profile is often read for where activity concentrated. A high-volume price is one where much volume traded, and a low-volume price is one where little traded. Traders often compare value area edges with earlier levels, such as support and resistance levels. These are ways of describing the chart, not rules that predict a result.
Market Profile is often read for its shape and for where the market was accepted. Practitioners describe whether a profile looks wide or narrow, and where the value area sits. These descriptions are subjective.
Volume profile differs from an indicator such as Chaikin money flow, which summarises volume over a set period as a line rather than a price histogram.
This guide explains volume profile and Market Profile in general and does not describe an RTX5 feature. No RTX5 release record confirms which indicators, chart types or alerts the product includes. Its Windows desktop client is in preview, and the web and mobile clients are planned. A Google Play listing for Android is published, but the mobile client has no approved release record yet; check the product-availability record before relying on any RTX5 feature.
Check RTX5 product availabilityTrust and methodology
We want you to be able to identify who owns the page, inspect the evidence, understand how tools were used, and challenge anything that looks wrong or out of date.
Published under the RTX5 Editorial Team byline. It identifies the responsible publishing organization; it does not imply that a named lawyer, regulator, financial adviser, or licensed expert approved this page.
5 primary references are listed on this page with context about what each one supports. The source set was checked on .
Automation and AI may help organize research, outline a page, or edit language. They are not treated as sources, are not presented as human experts, and do not remove the publisher's responsibility for the final page.
If a statement is incomplete, unsupported, or outdated, send the exact URL, sentence, and supporting evidence through our contact route. Read the full editorial and corrections policy.
Sources were checked on 10 November 2026. They explain market rules and concepts; they do not certify RTX5 or provide individual financial advice.
Volume profile totals the volume traded at each price over a chosen period. Market Profile, also called a TPO chart, counts how many time blocks traded at each price, with each block marked by a letter. Both can show a point of control and a value area, usually set at 70%. Volume profile needs volume data, while Market Profile needs time-stamped prices and a block size.
The point of control is the price level with the most activity in the profile. In volume profile it is the price with the highest traded volume. In Market Profile it is the price with the most TPOs. It describes the chosen window only, and it does not prove that price will return to that level.
The value area is the band of prices around the point of control that holds a set share of the profile, commonly 70%. It is built outward from the point of control, adding the larger neighbouring row each step. TradingView's volume procedure stops before a row would exceed the target; its TPO procedure adds rows until the target is reached. Its top and bottom are the value area high and low.
Standard Market Profile counts TPOs, which are time blocks, not traded volume, so a TPO chart does not show how much traded at each price. Some platforms show a volume profile beside a TPO chart, so check which data each part uses.
No. Both describe activity inside a chosen window using past prices. A high-volume price or a value area edge does not prove that price will hold, break or return to that level. Treat either profile as one description of the chart, alongside your own risk limits.