Accountable publisher
Published under the RTX5 Editorial Team byline. It identifies the responsible publishing organization; it does not imply that a named lawyer, regulator, financial adviser, or licensed expert approved this page.
Trading glossary
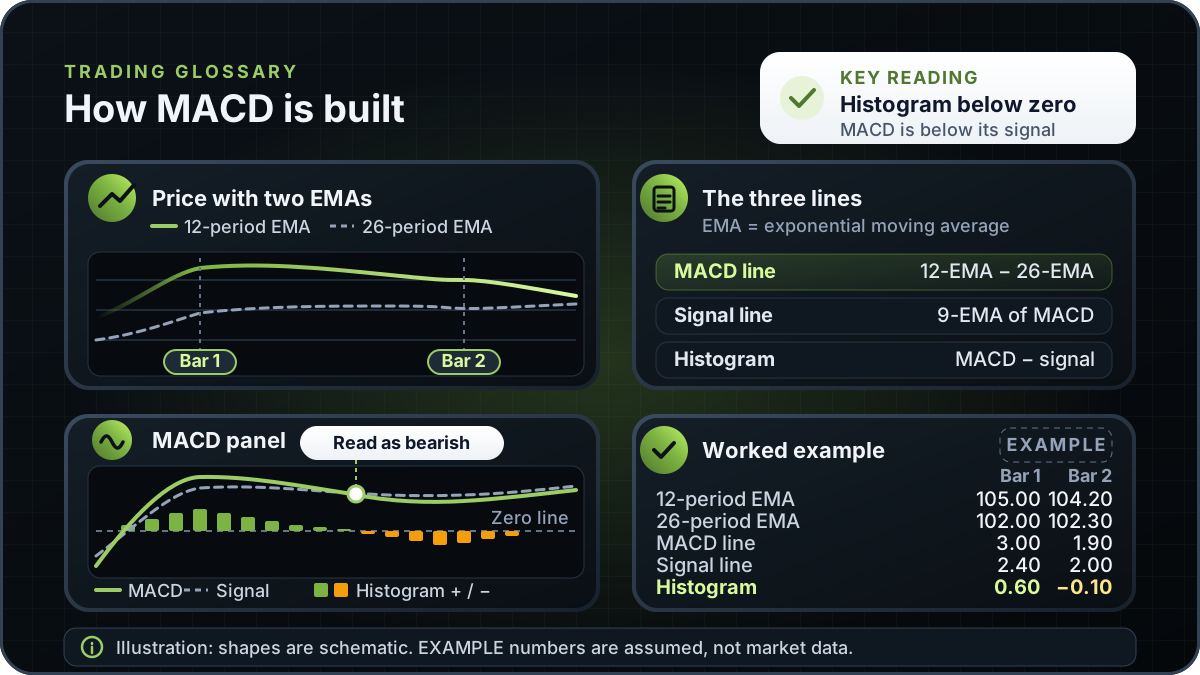
The MACD meaning is moving average convergence divergence, a momentum indicator. The MACD line is a 12-period exponential moving average (EMA) minus a 26-period EMA. A 9-period EMA of that line is the signal line, and the histogram is the gap between the two. It describes recent momentum and lags price.
In brief
The MACD meaning comes down to one comparison of two moving averages. Here is how each line is calculated, a worked example with simple numbers, how readings are described, and what the indicator cannot tell you.
MACD is built from two exponential moving averages of the same price series. An EMA gives more weight to recent closes than a simple average does. The MACD line is the faster average minus the slower one, so it rises when the short-term average pulls away from the long-term average and falls when the reverse happens. For the wider background on price-based tools, see technical analysis.
Because the line is a difference between two averages, it tracks the change in momentum rather than the price level. A MACD value of zero means the two averages are equal. It does not show that a price is cheap or expensive, and it does not say how far a move will go.
The periods count bars on the timeframe you chart. A 12-period EMA on a daily chart is a different calculation from a 12-period EMA on a one-minute chart, so always read the timeframe next to the settings. The AAII article on MACD describes the 12, 26 and 9 settings as the typical ones.
This example uses assumed values, not market data. Suppose that at the close of one bar the 12-period EMA is 105.00 and the 26-period EMA is 102.00. The MACD line is 105.00 minus 102.00, which is 3.00.
Suppose the signal line, the 9-period EMA of recent MACD values, is 2.40. The histogram is 3.00 minus 2.40, which is 0.60. It is positive because the MACD line sits above the signal line.
On the next bar, assume the 12-period EMA falls to 104.20 and the 26-period EMA is 102.30. The MACD line becomes 104.20 minus 102.30, which is 1.90. Assume the signal line is now 2.00. The MACD line has moved below the signal line, so the histogram is 1.90 minus 2.00, which is minus 0.10. The histogram has changed sign, and this page describes that as a bearish crossover.
The example shows the arithmetic, not the output of the formula. In a live chart the signal line is itself an average of many past MACD values, so the 2.40 and 2.00 figures are inputs chosen for the calculation.
Educational sources describe a small set of readings. The table lists each one and the limit that matters most. The third column is this page's reading of the indicator, not a claim made by the sources.
| Reading | Common description | What it does not prove |
|---|---|---|
| MACD line crosses above the signal line | Described as bullish | That the price will rise or that the move will last. The crossover shows a change in the gap between two averages. |
| MACD line crosses below the signal line | Described as bearish | That the price will fall. Several crossovers can occur inside one trading range. |
| MACD line crosses above the zero line | Described as bullish, because the short average is above the long average | That a new trend has started. Zero is the point where the two averages are equal. |
| MACD line crosses below the zero line | Described as bearish | That a downtrend will continue or that the price is overvalued. |
| Divergence: price makes a new high or low that MACD does not confirm | Described as a stronger signal when it confirms the crossover signals | That a reversal will follow. Divergence can persist while price keeps trending. |
Source: Fidelity's MACD guide lists the crossover and zero-line readings and says divergence is a stronger signal when it confirms the crossover signals. Verified on 9 November 2026.
These readings are conventions traders use to describe a chart. None of them measures how likely a price move is, and none of them is a forecast.
A momentum reading is more useful when you check it against the price itself. The guides on volume in trading and what is price action trading cover other inputs that can confirm or weaken a momentum reading.
The AAII article attributes MACD to Gerald Appel and dates its development to the late 1970s. AAII is a secondary source, so check Appel's own writing before quoting a year.
You can check the arithmetic on this page against any chart that displays MACD, as long as the chart uses the same 12, 26 and 9 settings. Confirm the settings and the histogram definition on the chart you use before comparing numbers.
The formula takes a series of closing prices as input and does not depend on the instrument. That is why the same three lines appear on charts of shares, index products, gold and currency pairs. The arithmetic does not change, but each price series behaves differently.
How often crossovers mislead depends on the market, its volatility and the period you chart. Test the indicator on the instrument you trade rather than assuming that a reading means the same thing everywhere. This page covers the definition, the arithmetic and the limits, not a trading strategy for any one market.
Charting software can draw MACD with different settings, so check the defaults on the chart you use against the formula above; for app comparisons, see MACD and RSI indicator apps for intraday use in 2026.
RTX5 is Orrnn's trading terminal and broker-technology product. Its Windows desktop client is in preview, and the web and mobile clients are planned. A Google Play listing for Android is published, but the mobile client has no approved release record yet; check the product-availability record before relying on any RTX5 feature. Indicators are on the planned list, so this page does not describe an RTX5 MACD feature. The numbers in the worked example are assumed.
Check RTX5 product availabilityTrust and methodology
We want you to be able to identify who owns the page, inspect the evidence, understand how tools were used, and challenge anything that looks wrong or out of date.
Published under the RTX5 Editorial Team byline. It identifies the responsible publishing organization; it does not imply that a named lawyer, regulator, financial adviser, or licensed expert approved this page.
3 primary references are listed on this page with context about what each one supports. The source set was checked on .
Automation and AI may help organize research, outline a page, or edit language. They are not treated as sources, are not presented as human experts, and do not remove the publisher's responsibility for the final page.
If a statement is incomplete, unsupported, or outdated, send the exact URL, sentence, and supporting evidence through our contact route. Read the full editorial and corrections policy.
Sources were checked on 9 November 2026. They explain market rules and concepts; they do not certify RTX5 or provide individual financial advice.
MACD stands for moving average convergence divergence. It is a momentum indicator built from two exponential moving averages. The MACD line is the 12-period EMA minus the 26-period EMA, the signal line is a 9-period EMA of that line, and the histogram shows the gap between them. The name describes the two averages moving toward and away from each other. It is not a forecast.
MACD is generally described as a lagging indicator, because both EMAs are built from past closing prices. The MACD line can turn after price has already changed direction. The periods can be adjusted, but every setting still averages past prices, so no setting removes the lag. Read MACD as a description of recent momentum, not as a signal of what comes next.
The MACD line is the faster 12-period EMA minus the slower 26-period EMA. The signal line is a 9-period EMA of the MACD line, so it smooths the MACD line itself. A crossover happens when the MACD line moves above or below the signal line. The histogram is the gap between them, and it is positive or negative depending on which line is higher.
No. This page explains conventions and does not give trading advice. A crossover describes a change in the gap between two averages. Educational sources describe crossovers as bullish or bearish, but they do not show that the price will follow. Entries, exits and position size belong in a plan that accounts for your own risk and circumstances.
The 12, 26 and 9 settings are the conventional defaults, and the AAII article describes them as typical while noting they can be adjusted. Changing a setting changes every reading the indicator gives. Whatever settings you choose, test them on the instrument and timeframe you trade, and do not pick them only because they fit a past chart.
The arithmetic is identical for any series of prices, so the three lines can be drawn on stocks, indices, commodities and currency pairs. How often crossovers mislead depends on the market, its volatility and the period you chart. Test the indicator on the instrument you trade rather than assuming a reading means the same thing everywhere.