Accountable publisher
Published under the RTX5 Editorial Team byline. It identifies the responsible publishing organization; it does not imply that a named lawyer, regulator, financial adviser, or licensed expert approved this page.
Technical indicators
An exponential moving average (EMA) is an average of closing prices that gives the most recent close the largest weight. Each new value is the previous EMA plus a smoothing multiplier, 2/(N+1), times the gap between the close and that previous EMA. Like any moving average, it describes past prices and lags them.
In brief
An exponential moving average weights recent closes more heavily than older ones. This guide covers the formula, a worked example you can check by hand, the comparison with the SMA, and the limits of reading crossovers.
An EMA is calculated one bar at a time. StockCharts ChartSchool writes each step as (close minus previous EMA) times the multiplier, plus the previous EMA, and gives the multiplier as 2 divided by the number of periods plus one. The StockCharts moving averages article states both.
MetaTrader 5 writes the recursion as CLOSE(i) times P plus EMA(i-1) times (1 minus P), where P is a percentage and is not tied to N. Check the period setting in your platform before matching a value to a formula.
The recursion needs a first value. StockCharts says to calculate a simple moving average and use it as the initial EMA value. In the worked example, the first EMA is therefore the three-bar SMA at bar 3.
The TradingView and MetaTrader 5 pages do not describe seeding, so the SMA start is one stated convention, not a rule every platform follows. Each later bar shrinks the influence of the start by a factor of one minus k. With k = 0.5, that influence halves on every bar.
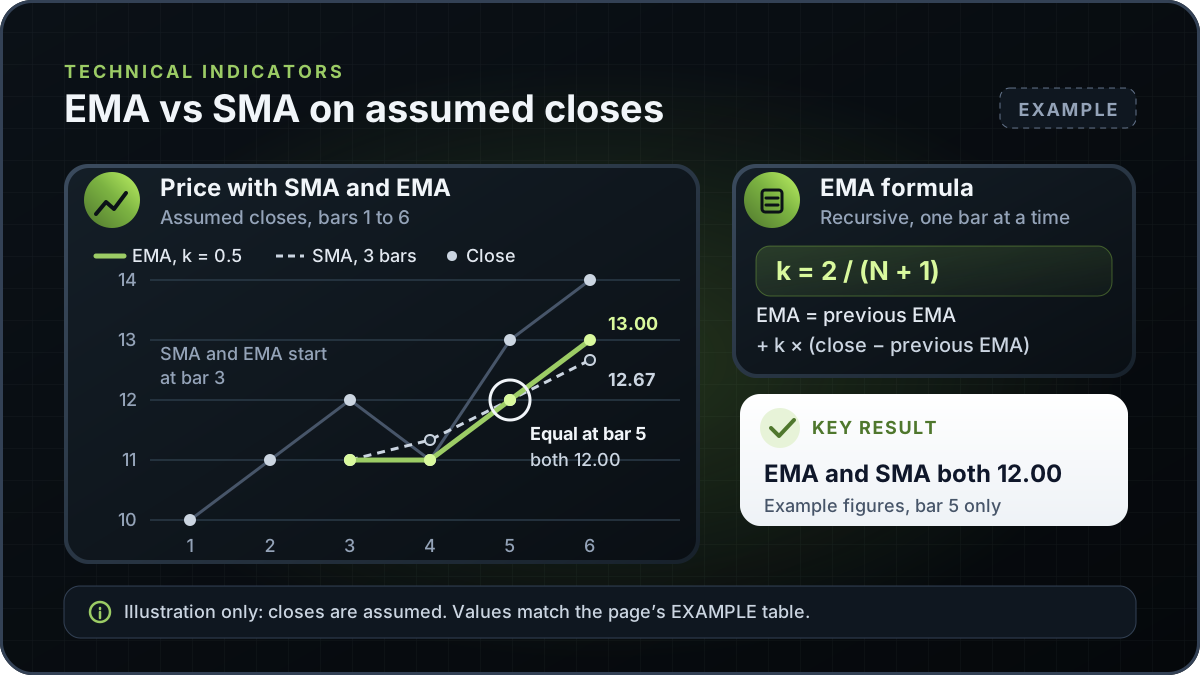
Example: the closes in this table are assumed for calculation practice. They are not market data. The SMA is the sum of the last three closes divided by three. The EMA uses k = 2 / (3 + 1) = 0.5 and starts from the SMA at bar 3.
| Bar | Close | 3-bar SMA | 3-bar EMA (k = 0.5) | EMA against SMA |
|---|---|---|---|---|
| 1 | 10.00 | Not defined | Not defined | Not defined |
| 2 | 11.00 | Not defined | Not defined | Not defined |
| 3 | 12.00 | 11.00 | 11.00 (seed equals SMA) | Equal |
| 4 | 11.00 | 11.33 | 11.00 | Below |
| 5 | 13.00 | 12.00 | 12.00 | Equal (crossover point) |
| 6 | 14.00 | 12.67 | 13.00 | Above |
Example figures. The SMA at bar 3 is (10 + 11 + 12) / 3 = 11.00, and that value seeds the EMA.
Check the arithmetic. At bar 4 the SMA is (11 + 12 + 11) / 3, which is 11.33. At bar 5 the EMA is 11.00 + 0.5 x (13.00 - 11.00), which is 12.00. At bar 6 the EMA is 12.00 + 0.5 x (14.00 - 12.00), which is 13.00, and the SMA is (11 + 13 + 14) / 3, which is 12.67.
From bar 5 to bar 6 the close rose by 1.00. The SMA rose by 0.67, because the newest close entered the window and the oldest one left. The EMA rose by 1.00, which is half of the 2.00 gap between the new close and the previous EMA.
EMA and SMA average the same closes but weigh the window differently and start at different points. The SMA formula comes from the MetaTrader 5 help page; the EMA multiplier, seed and lag comparison come from StockCharts.
| Feature | Simple moving average (SMA) | Exponential moving average (EMA) |
|---|---|---|
| Calculation | Sum of the last N closes divided by N | Previous EMA plus k times the gap between the close and the previous EMA, with k = 2/(N+1) |
| Weight given to each close | Equal weight to each of the N closes in the window | Most weight to the latest close. With N = 3 (k = 0.5), each older close carries half the weight of the next newer one |
| Change from one bar to the next | The new close minus the close that leaves the window, divided by N | k times the gap between the new close and the previous EMA |
| Starting point | Needs N closes before the first value | Seeded with an SMA of the first N closes, according to StockCharts |
| Lag | Lags price. StockCharts says the longer the moving average, the more the lag | Lags price. StockCharts says an EMA with recent data weighted more heavily lags less than an SMA, which suggests less lag at the same length, not none |
The lag row reflects the comparison StockCharts makes. This table does not measure lag on any instrument.
The faster response is a property of the weighting, not evidence that the EMA predicts price. A smaller lag does not remove the lag.
The cited references do not agree on one default length or starting method, so the table records each variant.
| Reference | Default length stated | Multiplier and start |
|---|---|---|
| StockCharts ChartSchool, SharpCharts overlays | EMA overlay set to 20 periods; SMA overlay set to 50 periods | Multiplier 2/(N+1); first value from an SMA |
| StockCharts ChartSchool, StockChartsACP | EMA and SMA both default to 20 periods | Multiplier 2/(N+1); first value from an SMA |
| TradingView support: Exponential Moving Average | The article says 9 days is the default | Multiplier in the formula; the article says most users opt for a smoothing value of 2 and does not describe the start |
| MetaTrader 5 help: Moving Average | No default period or method is stated | P is a percentage of the price; the page does not link P to N and does not describe the start |
Each row reports what that reference states on 10 November 2026.
Before comparing two charts, confirm the period, source price and starting method. A line labelled EMA 20 on one platform may not match EMA 20 on another.
A crossover happens when one moving average moves above or below another. StockCharts describes a bullish crossover as the shorter average crossing above the longer one, and a bearish crossover as the reverse. The two averages can both be EMAs, both be SMAs, or one of each.
The worked example has no shorter and longer pair, because both lines use three bars. It shows the mechanics instead: both averages are 12.00 at bar 5, and the EMA is above the SMA at bar 6. This is a reading of the arithmetic, not a trading rule. For a crossover built from two EMAs, see the MACD guide.
Name the two averages, their periods, the direction and the bar where it happened. Words such as confirmed or reliable overstate what a crossover shows. The cited pages give no tested hit rates for EMA crossovers, so none are given here.
Other methods, each with its own limits, are covered in the price action trading, SuperTrend indicator and TRIX indicator guides.
The references cited in this guide describe the formula but do not name who first devised it. This guide therefore gives no originator or origin date. Check a primary text before you quote one.
This guide explains the exponential moving average in general and does not describe an RTX5 feature. No RTX5 release record confirms which indicators, chart types or alerts the product includes. RTX5 is Orrnn's trading terminal and broker-technology product. Its Windows desktop client is in preview, and the web and mobile clients are planned. A Google Play listing for Android is published, but the mobile client has no approved release record yet; check the product-availability record before relying on any RTX5 feature.
Check RTX5 product availabilityTrust and methodology
We want you to be able to identify who owns the page, inspect the evidence, understand how tools were used, and challenge anything that looks wrong or out of date.
Published under the RTX5 Editorial Team byline. It identifies the responsible publishing organization; it does not imply that a named lawyer, regulator, financial adviser, or licensed expert approved this page.
4 primary references are listed on this page with context about what each one supports. The source set was checked on .
Automation and AI may help organize research, outline a page, or edit language. They are not treated as sources, are not presented as human experts, and do not remove the publisher's responsibility for the final page.
If a statement is incomplete, unsupported, or outdated, send the exact URL, sentence, and supporting evidence through our contact route. Read the full editorial and corrections policy.
Sources were checked on 10 November 2026. They explain market rules and concepts; they do not certify RTX5 or provide individual financial advice.
The EMA today equals (the closing price minus yesterday's EMA) times the multiplier, plus yesterday's EMA. The multiplier is 2 divided by the number of periods plus one. For a 3-period EMA it is 0.5, and for a 10-period EMA it is 2/11, about 18.18%.
A simple moving average gives every close in its window the same weight and drops the oldest close as each new bar arrives. An EMA reuses the previous EMA, so older closes never drop out completely, but their influence falls with each bar. In the worked example, the 3-period EMA reaches 13.00 at bar 6, while the 3-period SMA reaches 12.67.
No. This guide gives no trading advice. Educational sources describe a bullish crossover as the shorter average moving above the longer one, and a bearish crossover as the reverse. Those descriptions do not show that price will follow, because a crossover happens after the averages have already moved and can repeat inside a trading range.
No length is correct for every market. The references cited in this guide differ: StockCharts sets the EMA overlay to 20 periods in SharpCharts, and the TradingView article describes 9 days as its default. Choosing a length to fit a past chart is curve fitting. Test any choice on the instrument and timeframe you trade.
Yes. Every EMA is built from past closes, so it reacts after price moves. StockCharts says an EMA with recent data weighted more heavily lags less than an SMA. For two averages of the same length, that suggests the EMA lags less, but it still lags. A shorter period reacts sooner and to more noise, while a longer period smooths more and reacts later.
The references cited in this guide describe the formula but do not name the person who first devised it, so this guide does not attribute the EMA to an individual or give an origin date. Check a primary text before you quote an originator or a year.