Accountable publisher
Published under the RTX5 Editorial Team byline. It identifies the responsible publishing organization; it does not imply that a named lawyer, regulator, financial adviser, or licensed expert approved this page.
Technical indicators
The TRIX indicator is a momentum indicator developed by Jack Hutson in the early 1980s. It takes an exponential moving average of an exponential moving average of an exponential moving average of close, then plots the one-period percent change of that triple-smoothed value around a zero line. StockCharts uses 15 and 9 as defaults.
In brief
The TRIX indicator smooths price three times with an exponential moving average and then reads the one-period change. This guide sets out the origin, the formula, the default settings, a worked percent-change example, the zero line and signal line, and where the references differ.
The StockCharts ChartSchool TRIX page says Jack Hutson developed TRIX in the early 1980s, when he was an editor for Technical Analysis of Stocks and Commodities magazine. The TradingView support article on TRIX gives the same attribution and the same early 1980s date, in its History section. That is the attribution this guide uses. Other publications may give a different date or detail, so check the original article before you cite it formally.
The page describes TRIX as an EMA of an EMA of an EMA. The idea is repeated smoothing of one price series, so every reading is a reading of the smoothed series rather than of the raw close.
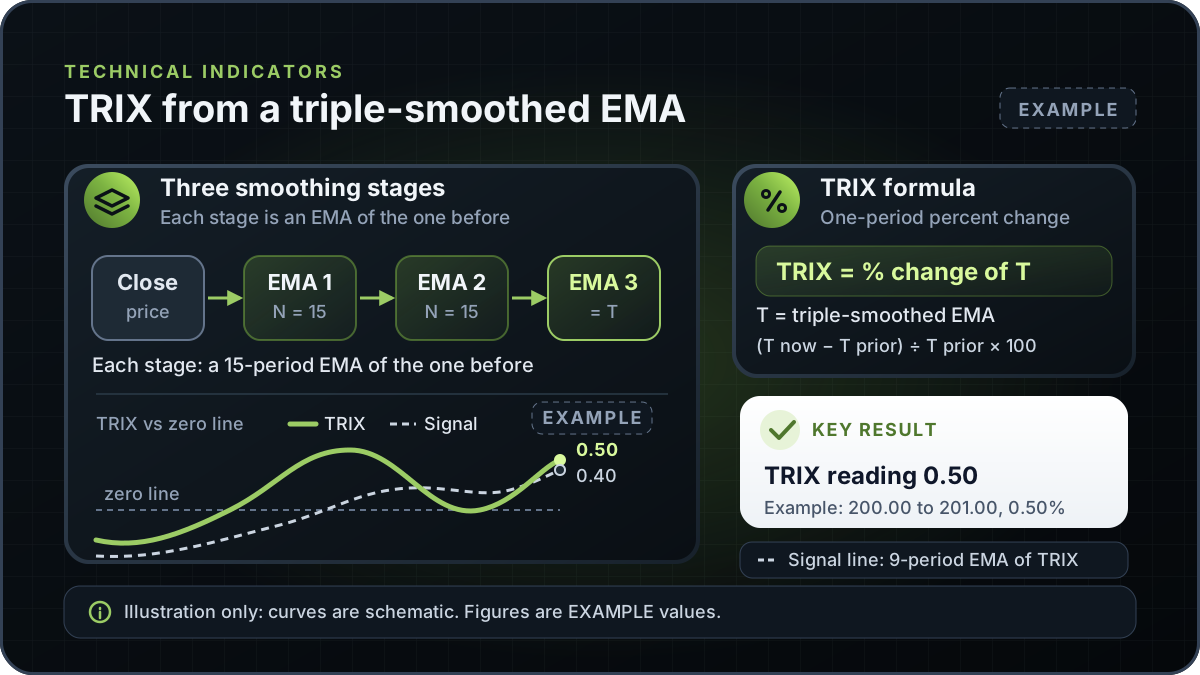
TRIX applies three chained exponential moving averages to the close, and the third output is the triple-smoothed EMA that TRIX uses. StockCharts uses 15 periods for each average; the variants table below shows what other references use.
The exponential moving average guide explains how each of those averages is calculated, so this section does not repeat that arithmetic.
StockCharts defines TRIX as the one-period percent change in the triple-smoothed EMA. Let T stand for the triple-smoothed EMA on a bar. The TRIX reading is then:
StockCharts describes this step in words. The MetaTrader 5 help page prints the same change as (EMA3 on the latest bar minus EMA3 on the prior bar) ÷ EMA3 on the prior bar, without the × 100. The 9-period signal line is stated on the StockCharts page.
The table uses assumed triple-smoothed EMA values. They are not market data. They were chosen so the arithmetic is short and can be checked by hand.
| Item | Example value | How it is calculated |
|---|---|---|
| Triple-smoothed EMA, prior bar | 200.00 | Assumed input |
| Triple-smoothed EMA, latest bar | 201.00 | Assumed input |
| Change over one bar | 1.00 | 201.00 minus 200.00 |
| Percent change | 0.50% | 1.00 ÷ 200.00 × 100 |
| TRIX reading | 0.50 | The percent change, shown without the % sign |
Example figures. The two EMA inputs are assumed, and the arithmetic is exact.
The reading is positive because the triple-smoothed EMA rose on this bar. It says nothing about the bar that follows. The signal line in the diagram is shown at 0.40 as an EXAMPLE input. Working the signal line out by hand would need a run of TRIX values and an EMA seed, which is why this guide does not calculate it.
Because TRIX is a percent change, its zero line marks the point where the triple-smoothed EMA stops rising or falling on the last bar. StockCharts says TRIX is negative while the triple-smoothed EMA falls and turns positive when it rises.
The same page describes a bullish signal line crossover as TRIX turning up and crossing above its signal line, and a bearish crossover as TRIX turning down and crossing below it. Read these as definitions of the crossover, not as forecasts. A crossover can happen in a sideways market and reverse within a few bars.
StockCharts gives 15 for the triple-smoothed EMA and 9 for the signal line, and this guide uses that pair. The table below sets the StockCharts, TradingView and MetaTrader 5 descriptions of TRIX side by side. MetaTrader 5 lists the indicator as Triple Exponential Average, in its oscillators group.
| Item | StockCharts ChartSchool | TradingView support | MetaTrader 5 help (Triple Exponential Average) |
|---|---|---|---|
| Smoothed EMA length | 15 periods | 18 periods for each of the three EMAs | Period N; no default stated |
| Signal line | 9-period EMA of TRIX | Typically an EMA of TRIX; default length not stated | Not mentioned |
| Calculation | One-period percent change of the triple EMA | One-period percent change of the triple-smoothed EMA | (EMA3 on the latest bar − EMA3 on the prior bar) ÷ EMA3 on the prior bar, with no × 100 |
| Originator | Jack Hutson, early 1980s | Jack Hutson, early 1980s (History section) | Jack Hutson; no date given |
Checked 10 November 2026. Only the StockCharts and TradingView pages state TRIX default lengths. The MetaTrader 5 formula has no × 100, so the same move reads 0.005 there and 0.50 as a percentage.
MetaTrader 5 also has a separate indicator with a similar name, the Triple Exponential Moving Average (TEMA). Its help page gives a different formula, 3 × EMA − 3 × EMA2 + EMA3, and credits Patrick Mulloy, so do not read the TEMA page as documentation for TRIX. Before you compare a reading with a published example, check the length, the signal period and the calculation in the platform you use.
TRIX is built only from past closes. Three smoothing stages make the line respond slowly to new closes, so a turn in TRIX can arrive after a turn in price. That lag is the cost of the smoothing, and it is why TRIX is best read as a description of recent direction.
Settings change the output. A shorter EMA length responds faster and produces more turns, while a longer one lags more. A reading from one setting cannot be compared directly with a reading from another. For a different momentum view, the stochastic oscillator guide describes a range-based calculation, and the MACD guide explains a momentum measure built from two EMAs. The know sure thing indicator guide covers a separate calculation that sums smoothed rate-of-change lines.
TRIX does not show volume, news or the size of a move in currency terms, and it does not show whether a crossover will hold.
This guide explains the TRIX indicator in general and does not describe an RTX5 feature. No RTX5 release record confirms which indicators, chart types or alerts the product includes. RTX5 is Orrnn's trading terminal and broker-technology product. Its Windows desktop client is in preview, and the web and mobile clients are planned. A Google Play listing for Android is published, but the mobile client has no approved release record yet. Check the product-availability record before relying on any RTX5 feature.
Check RTX5 product availabilityTrust and methodology
We want you to be able to identify who owns the page, inspect the evidence, understand how tools were used, and challenge anything that looks wrong or out of date.
Published under the RTX5 Editorial Team byline. It identifies the responsible publishing organization; it does not imply that a named lawyer, regulator, financial adviser, or licensed expert approved this page.
6 primary references are listed on this page with context about what each one supports. The source set was checked on .
Automation and AI may help organize research, outline a page, or edit language. They are not treated as sources, are not presented as human experts, and do not remove the publisher's responsibility for the final page.
If a statement is incomplete, unsupported, or outdated, send the exact URL, sentence, and supporting evidence through our contact route. Read the full editorial and corrections policy.
Sources were checked on 10 November 2026. They explain market rules and concepts; they do not certify RTX5 or provide individual financial advice.
The TRIX indicator measures the one-period percent change in a triple-smoothed exponential moving average of the close. Its line sits around a zero line. A positive reading means the smoothed value rose over the last bar, and a negative reading means it fell. The indicator describes past closes and does not forecast the next bar.
StockCharts ChartSchool credits Jack Hutson, who described TRIX in the early 1980s while he was an editor for Technical Analysis of Stocks and Commodities magazine. The TradingView support article gives the same attribution and early 1980s date. Other publications may give a different date or detail, so check the original article before you cite it formally.
StockCharts uses 15 periods for the triple-smoothed EMA and 9 periods for the signal line, which is a 9-period EMA of TRIX. This guide uses those defaults. The TradingView support article uses 18 periods for each of its three EMAs and does not state a default signal length. MetaTrader 5's help page states no default, so check your own settings before comparing readings.
No. The MetaTrader 5 help page describes a triple exponential moving average as 3 × EMA minus 3 × EMA2 plus EMA3. TRIX instead takes the one-period percent change of a triple-smoothed EMA. Both use three smoothing stages, but they produce different lines.
Both are built from exponential moving averages, but they are calculated differently. MACD is built from the gap between two EMAs, while TRIX is the one-period percent change of one triple-smoothed EMA. Their readings are therefore not interchangeable. The MACD guide explains that calculation.
No. A crossover describes a change in the relationship between two lines that are both built from past closes. TRIX does not forecast price, and a crossover can reverse within a few bars. Any decision needs its own rules, risk limits and testing, which this guide does not provide.