Accountable publisher
Published under the RTX5 Editorial Team byline. It identifies the responsible publishing organization; it does not imply that a named lawyer, regulator, financial adviser, or licensed expert approved this page.
Technical indicators
The stochastic oscillator is a momentum indicator developed by George Lane. %K compares the latest close with the highest high and lowest low of the last 14 periods, scaled from 0 to 100, and in the standard form %D is a 3-period simple moving average of %K. Readings describe recent price position, not future moves.
In brief
The stochastic oscillator compares where a close sits within its recent high-low range. Here is how %K and %D are calculated, a worked example, how the fast, slow and full forms differ, and how Stochastic RSI applies the same formula to RSI.
The stochastic oscillator is a momentum indicator that George Lane developed in the late 1950s, according to StockCharts ChartSchool. The indicator turns the position of the close within the recent range into a number between 0 and 100.
It describes where the latest close sits inside a fixed look-back window. For a different momentum approach, read what is MACD, which compares two moving averages instead of a price range.
| Reference | %D method | Defaults printed | Scale |
|---|---|---|---|
| StockCharts ChartSchool (Fast, Slow and Full) | Simple moving average (SMA) of %K | 14, 3 (Fast and Slow); 14, 3, 3 (Full) | 0 to 100 |
| MetaTrader 5 help (Stochastic Oscillator) | Exponential, Simple, Smoothed or Weighted, chosen in the %D method input | None printed on the help page | Not stated on the page |
Sources: StockCharts ChartSchool, Stochastic Oscillator Fast, Slow, and Full; MetaTrader 5 help, Stochastic Oscillator. Checked 10 November 2026.
The variants above differ in %D method, printed defaults and scale, so check the settings on your own platform before comparing readings.
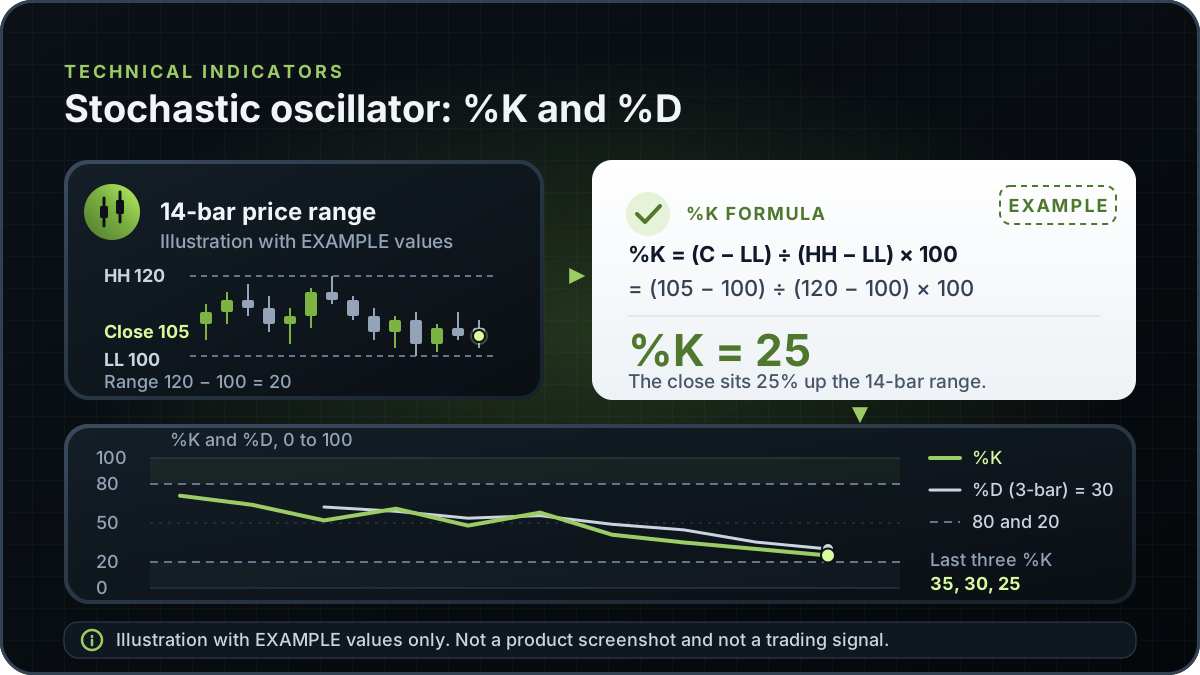
This is an Example with invented numbers, not market data. Over the last 14 bars the highest high is 120 and the lowest low is 100, so the range is 20 points. The latest close is 105.
Example: %K = (105 minus 100) divided by (120 minus 100), multiplied by 100 = 5 divided by 20, multiplied by 100 = 25. The close sits 25% of the way up the range, so %K reads 25.
Example: for %D, take the last three %K values, which are 35, 30 and 25 in this Example. Their average is (35 + 30 + 25) divided by 3 = 30, so %D is 30. Here %K sits below %D. That describes the recent direction of the two lines, and it says nothing about the next bar.
StockCharts sets out three forms with the same 14-period look-back and different smoothing. The table compares them.
| Form | %K | %D | Default settings |
|---|---|---|---|
| Fast | Raw %K from the formula | 3-period average of fast %K | 14, 3 |
| Slow | 3-period average of fast %K | 3-period average of slow %K | 14, 3 |
| Full | Fast %K smoothed over the %K smoothing period | SMA of full %K over the %D period | 14, 3, 3 (look-back, %K smoothing, %D period) |
Source: StockCharts ChartSchool, Stochastic Oscillator Fast, Slow, and Full. The full form has three settings you choose: look-back (14), %K smoothing (3) and %D period (3), which are StockCharts defaults. Checked 10 November 2026.
Smoothing changes how closely the lines follow the raw %K readings. Which form suits a chart is a matter of testing your own settings, and any result describes the past.
The conventional levels are 80 and 20. StockCharts describes 80 and 20 as the traditional overbought and oversold thresholds, and says the levels can be adjusted to suit analytical needs. It also uses 50 as a centreline. In this guide the labels describe where %K sits in its range. They are not signals that a price is about to turn.
Stochastic RSI, often written StochRSI, applies the stochastic formula to a series of relative strength index (RSI) values instead of to closing prices. StockCharts credits Tushar Chande and Stanley Kroll with developing it. RSI is a separate momentum measure, and this guide does not explain it in full.
StockCharts gives the formula as (RSI minus lowest RSI) divided by (highest RSI minus lowest RSI), with a default look-back of 14 periods. The table sets the two versions side by side.
| Measure | Input series | Core formula | Default | Scale and levels |
|---|---|---|---|---|
| Stochastic oscillator (%K) | Closes with the high and low range | (C minus LL) divided by (HH minus LL) | 14, with 3 for smoothing and %D | 0 to 100, with 80 and 20 levels |
| Stochastic RSI | RSI values | (RSI minus lowest RSI) divided by (highest RSI minus lowest RSI) | 14 (StockCharts) | 0 to 1 on StockCharts, with 0.80, 0.20 and 0.50 levels |
Sources: StockCharts ChartSchool, StochRSI and Stochastic Oscillator Fast, Slow, and Full. Checked 10 November 2026.
The variant to check is the scale. StockCharts shows StochRSI from 0 to 1, so 0.80 and 0.20 match 80 and 20 on a 0 to 100 scale. Settings and scales vary between platforms, so confirm which one your chart uses before you compare readings with a written example.
Because StochRSI applies the range calculation to a series that is already a derived momentum value, its readings reflect RSI as well as price. That is a property of the arithmetic, not a forecast.
Charting texts describe %K crossing %D, lines moving above 80 or below 20, and divergence between the lines and price. A crossover shows that the fast line moved relative to its average. It does not show that the move will hold.
Crossovers in a sideways market can repeat several times, so one cross shows only a single recent change in the position of the two lines. The stochastic shares the high-low range idea with Williams %R. For a different design, see the Ultimate Oscillator.
Before using any reading in a plan, check the settings and the scale on your own platform. To compare a stop and a target against a reading, see the risk-reward ratio.
This guide explains the stochastic oscillator in general and does not describe an RTX5 feature. No RTX5 release record confirms which indicators, chart types or alerts the product includes. Its Windows desktop client is in preview, and the web and mobile clients are planned. A Google Play listing for Android is published, but the mobile client has no approved release record yet; check the product-availability record before relying on any RTX5 feature.
Check RTX5 product availabilityTrust and methodology
We want you to be able to identify who owns the page, inspect the evidence, understand how tools were used, and challenge anything that looks wrong or out of date.
Published under the RTX5 Editorial Team byline. It identifies the responsible publishing organization; it does not imply that a named lawyer, regulator, financial adviser, or licensed expert approved this page.
4 primary references are listed on this page with context about what each one supports. The source set was checked on .
Automation and AI may help organize research, outline a page, or edit language. They are not treated as sources, are not presented as human experts, and do not remove the publisher's responsibility for the final page.
If a statement is incomplete, unsupported, or outdated, send the exact URL, sentence, and supporting evidence through our contact route. Read the full editorial and corrections policy.
Sources were checked on 10 November 2026. They explain market rules and concepts; they do not certify RTX5 or provide individual financial advice.
The stochastic oscillator is a momentum indicator developed by George Lane. It compares the latest close with the highest high and lowest low over a look-back period, usually 14 periods, and scales the result from 0 to 100. In the standard form the %D line is a 3-period simple moving average of %K. It describes where price closed within its recent range, and it does not show the next move.
In the fast form, %K is the raw reading: the position of the latest close within the look-back range, from 0 to 100. The slow and full forms smooth it first. %D is a moving average of %K, a 3-period simple average in the StockCharts default, so it moves more slowly. Traders describe crossovers between the two lines, but a crossover describes past readings and does not prove that a trend will continue.
The fast form uses the raw %K and a 3-period average for %D. The slow form smooths %K with a 3-period average before taking %D, which makes the lines steadier. The full form lets you set the look-back, the %K smoothing and the %D period. StockCharts uses 14, 3 and 3 as defaults. Check your platform's settings, because defaults and labels differ between platforms.
Stochastic RSI applies the stochastic formula to a series of RSI values instead of closing prices. Tushar Chande and Stanley Kroll are credited with developing it. StockCharts gives the formula as (RSI minus lowest RSI) divided by the RSI range, with a default look-back of 14 periods, and shows it on a 0 to 1 scale. Check the scale your platform uses before you compare readings.
No. The 80 and 20 levels are conventional markers on the 0 to 100 scale, which places them at the upper and lower fifths of the look-back range. A reading above 80 places the close near the top of that range, and a reading below 20 places it near the bottom. Price can stay in either zone for a long time, so a level describes position rather than timing, and it is not advice.
This guide cannot say that it works. The indicator is arithmetic on past prices and makes no claim about future results. Its readings depend on the settings, the scale and the market, and they can produce repeated crossovers in a range. Test any use on your own data, and do not treat a stochastic reading as a reason to trade.