Accountable publisher
Published under the RTX5 Editorial Team byline. It identifies the responsible publishing organization; it does not imply that a named lawyer, regulator, financial adviser, or licensed expert approved this page.
Indicator guide
The ultimate oscillator is a momentum indicator developed by Larry Williams. It measures buying pressure against true range over three lookback periods, usually 7, 14 and 28 bars, and combines them with weights of 4, 2 and 1 on a scale from 0 to 100. It describes past prices and does not predict them.
In brief
The ultimate oscillator combines short, medium and long buying-pressure averages into one 0 to 100 reading. Here is how it is built, with a worked example and its limits.
Larry Williams developed the ultimate oscillator (UO) in 1976, and it was featured in Stocks & Commodities magazine in 1985. StockCharts and TradingView both give these dates.
First, buying pressure (BP) is the close minus the lower of the current low and the prior close. Second, true range (TR) is the higher of the current high and the prior close, minus the lower of the current low and the prior close. Third, each average is the sum of BP over its period divided by the sum of TR over the same period. The final UO is 100 times the weighted sum of the three averages, divided by 7.
| Element | Definition or default | Where it is stated |
|---|---|---|
| Buying pressure (BP) | Close minus the lower of the current low or the prior close | StockCharts; TradingView |
| True range (TR) | Higher of the current high or the prior close, minus the lower of the current low or the prior close | StockCharts; TradingView |
| Average over n bars | Sum of BP over n bars divided by the sum of TR over n bars | StockCharts; TradingView; MetaQuotes code base |
| Periods | 7, 14 and 28 bars | StockCharts; TradingView; MetaQuotes code base |
| Weights | 4 for the 7-bar average, 2 for the 14-bar average, 1 for the 28-bar average; total 7 | StockCharts; TradingView |
| Scale | 0 to 100, with 50 as the centreline | MetaQuotes code base |
Formula checked against the cited sources on 10 November 2026.
The indicator averages three windows instead of one, so the reading does not depend on a single lookback. The weights make the shortest window dominant. TradingView states that the design gives the most weight to the shortest time frame, which is the 7-bar average. The 14-bar and 28-bar averages move the reading more slowly.
Because the weights are fixed, a change in the 7-bar average moves the result more than the same change in the 28-bar average. The worked example below measures that effect. It is one reason to read the oscillator as a blend of recent and older pressure.
The indicator sits in the same family as Williams %R and the stochastic oscillator, which both compare a close with a recent range. The ultimate oscillator differs because it measures buying pressure against true range and blends three windows. True range is also the building block of the average true range measure.
The sources checked use the 30 and 70 levels in different ways. StockCharts places them inside its divergence signals: the low of a bullish divergence should be below 30, so that prices are "somewhat oversold", and the high of a bearish divergence should be above 70, so that prices are "somewhat overbought". TradingView's indicator article gives the same two divergence conditions. TradingView's technical rating for UO is a separate rule that reads a value above 70 as a buy and below 30 as a sell. Its composite Oscillator rating includes UO as one of 11 inputs.
The MetaQuotes code base page is the third source. Its text reverses the StockCharts labels and says values below 30 correspond with the overbought zone, and values from 70 to 100 with the oversold zone. That is the opposite of the StockCharts wording, so this guide does not adopt it.
| Item | StockCharts | TradingView | MetaQuotes code base |
|---|---|---|---|
| Default periods | 7, 14, 28 | 7, 14, 28 | 7, 14, 28 bars |
| 30 and 70 levels | Divergence conditions: a bullish low below 30 ("somewhat oversold"), a bearish high above 70 ("somewhat overbought") | Indicator article: the same divergence conditions. Technical rating for UO: above 70 buy, below 30 sell, neutral between | Text labels the zones the other way round from StockCharts; this guide follows StockCharts |
| Centreline | 50 as the bull-bear centreline | Not stated | Centre is 50 |
| Other periods | Shortening to (4, 8, 16) "increased sensitivity"; longer periods to reduce sensitivity for high-volatility securities; (20, 40, 80) read as favouring bulls above 50 and bears below 50 | Parameters may need adjusting, because some instruments reach the levels too rarely or too often | Three periods can be set manually; no alternatives given |
Where the sources differ, this guide shows each version rather than picking one silently. Verified on 10 November 2026.
Example, one bar. Suppose the prior close is 50, the high is 52, the low is 49 and the close is 51. The lower of the low and prior close is 49, so BP is 51 minus 49, which is 2. The higher of the high and prior close is 52, so TR is 52 minus 49, which is 3. The bar's BP to TR ratio is 2 divided by 3, about 0.667.
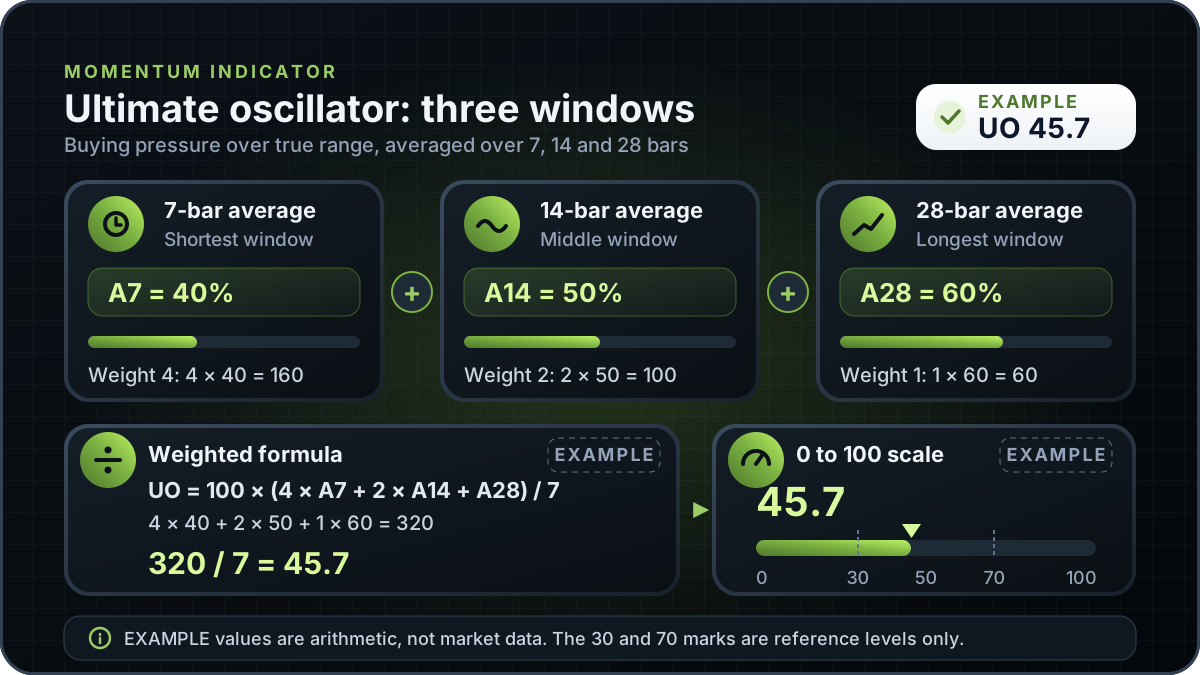
Example, the final reading. This example uses averages that have already been calculated. Let the 7-bar average be 0.40, the 14-bar average 0.50 and the 28-bar average 0.60. The weighted total is 4 x 0.40, plus 2 x 0.50, plus 1 x 0.60, which equals 3.20. Dividing by 7 gives 0.457, and multiplying by 100 gives 45.7. Each average is shown as a percentage in the diagram.
Example, sensitivity. Raise the 7-bar average from 0.40 to 0.50 and leave the others unchanged. The weighted total rises by 0.40, to 3.60, so the reading becomes 100 x 3.60 / 7, or 51.4. That is a change of 5.7 points. The same 0.10 change in the 28-bar average would move the reading by only 1.4 points.
| Average | Bars | Weight | Average value | Weight x value |
|---|---|---|---|---|
| A7 | 7 | 4 | 0.40 | 1.60 |
| A14 | 14 | 2 | 0.50 | 1.00 |
| A28 | 28 | 1 | 0.60 | 0.60 |
| Total | 7 | 3.20 | ||
| UO = 100 x 3.20 / 7 | 45.7 |
EXAMPLE arithmetic with given averages, rounded to one decimal place. Not market data and not a signal.
This guide explains the ultimate oscillator in general and does not describe an RTX5 feature. No RTX5 release record confirms which indicators, chart types or alerts the product includes. Its Windows desktop client is in preview, and the web and mobile clients are planned. A Google Play listing for Android is published, but the mobile client has no approved release record yet; check the product-availability record before relying on any RTX5 feature.
Check RTX5 product availabilityTrust and methodology
We want you to be able to identify who owns the page, inspect the evidence, understand how tools were used, and challenge anything that looks wrong or out of date.
Published under the RTX5 Editorial Team byline. It identifies the responsible publishing organization; it does not imply that a named lawyer, regulator, financial adviser, or licensed expert approved this page.
5 primary references are listed on this page with context about what each one supports. The source set was checked on .
Automation and AI may help organize research, outline a page, or edit language. They are not treated as sources, are not presented as human experts, and do not remove the publisher's responsibility for the final page.
If a statement is incomplete, unsupported, or outdated, send the exact URL, sentence, and supporting evidence through our contact route. Read the full editorial and corrections policy.
Sources were checked on 10 November 2026. They explain market rules and concepts; they do not certify RTX5 or provide individual financial advice.
UO = 100 x (4 x A7 + 2 x A14 + A28) / 7, where A7, A14 and A28 are the sums of buying pressure divided by the sums of true range over 7, 14 and 28 bars. Buying pressure is the close minus the lower of the current low and the prior close. True range is the higher of the current high and prior close, minus that same lower value.
Larry Williams developed the ultimate oscillator in 1976, according to StockCharts and TradingView. Both sources say it was featured in Stocks & Commodities magazine in 1985. TradingView adds that the weighting gives the most weight to the shortest time frame, which is the 7-bar average.
The sources checked use them differently. StockCharts and TradingView's indicator article use 30 and 70 as divergence conditions, and StockCharts describes a low below 30 as somewhat oversold and a high above 70 as somewhat overbought. TradingView's technical rating for UO treats a reading above 70 as a buy and below 30 as a sell. The MetaQuotes page labels the zones the other way round. None of these is a general rule.
The default periods in the sources checked are 7, 14 and 28 bars. StockCharts says relatively docile securities may not reach overbought or oversold readings with the defaults, and shows that shortening to 4, 8 and 16 "increased sensitivity". For highly volatile securities it lengthens the periods instead, and it reads a 20, 40 and 80 setting against the 50 line. TradingView says parameters may need adjusting. Changing the periods changes every reading, and this guide gives no test of any set.
No. It is calculated from price bars that have already printed. It can show how buying pressure compares with true range over three windows, but it cannot show future prices. TradingView states that the indicator should not be used as a stand-alone signal system, and a divergence between price and the oscillator does not show when or whether price will move.
This guide does not describe an RTX5 feature, and no RTX5 release record confirms which indicators the product includes. RTX5 is Orrnn's trading terminal and broker-technology product. Its Windows desktop client is in preview, and the web and mobile clients are planned. A Google Play listing for Android is published, but the mobile client has no approved release record yet; check the product-availability record before relying on any RTX5 feature.