Accountable publisher
Published under the RTX5 Editorial Team byline. It identifies the responsible publishing organization; it does not imply that a named lawyer, regulator, financial adviser, or licensed expert approved this page.
Momentum indicators
Williams %R, also called Williams R or the williams percent range, is a momentum oscillator developed by Larry Williams. It compares the latest close with the highest high and lowest low over a lookback period, usually 14 bars, and plots the result on a scale from 0 to -100.
In brief
Williams %R is a range-based momentum oscillator. It shows where the latest close sits within the recent high-low range, and why its readings can stay extreme during a trend.
Williams %R uses a lookback period of n bars. Within that window, take the highest high and the lowest low, then compare the current close with that range. StockCharts gives the formula as (Highest High minus Close) divided by (Highest High minus Lowest Low), multiplied by -100, with a default lookback of 14 periods. StockCharts credits Larry Williams as its developer and gives no date for its introduction.
Because the result is multiplied by -100, the scale runs from 0 when the close equals the highest high to -100 when the close equals the lowest low. The MetaTrader 5 help page writes the same calculation in its own notation. It places a minus symbol before the values and says one should ignore the minus symbol when conducting the analysis. The table sets out where the two sources agree and where they differ.
| Element | StockCharts ChartSchool | MetaTrader 5 help |
|---|---|---|
| Developer | Larry Williams, no date given | Not stated on the page |
| Formula | (Highest High minus Close) / (Highest High minus Lowest Low) x -100 | -(MAX(HIGH) minus CLOSE) / (MAX(HIGH) minus MIN(LOW)) x 100, window written as the previous n periods |
| Default lookback | 14 periods | No default stated on the page |
| Scale | 0 to -100 | 0 to -100; the page says to ignore the minus symbol when analysing |
| Overbought band | 0 to -20 | 0% to -20% |
| Oversold band | -80 to -100 | -80% to -100% |
| Centreline | -50 | Not stated |
Verified on 10 November 2026 from the two pages named. The MT5 window notation does not show clearly whether the current bar is included, so confirm that setting on your own platform. Changing the lookback changes every reading.
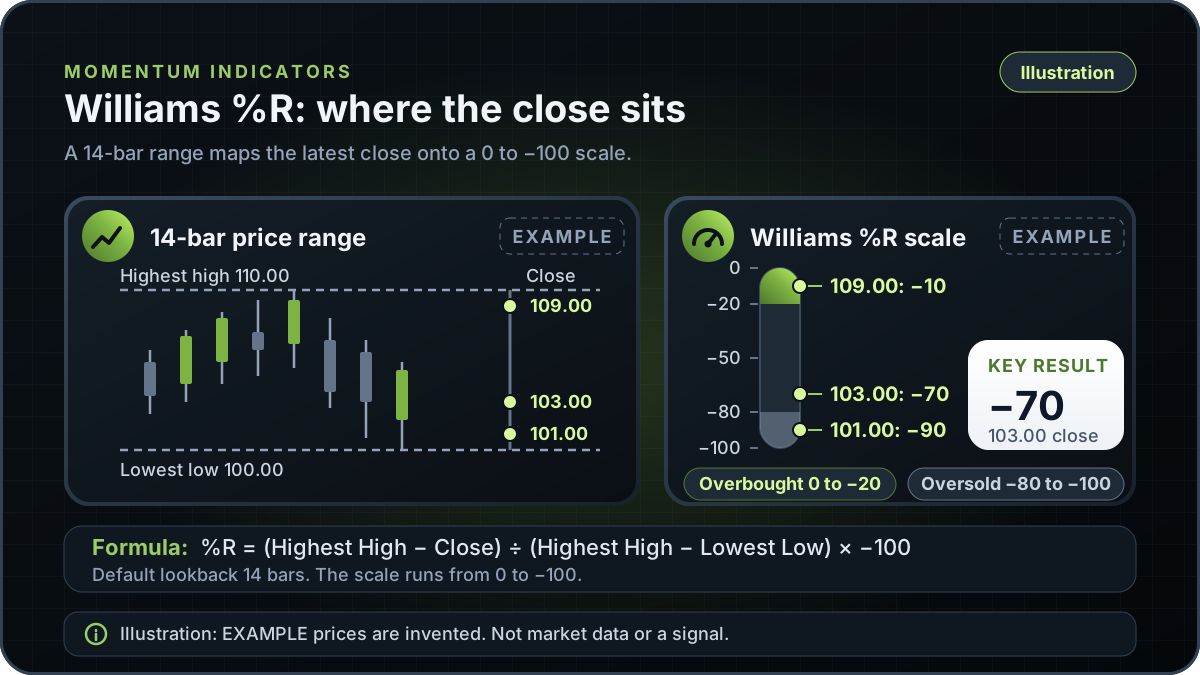
This is an illustrative example with invented prices, not market data. Suppose the highest high over the last 14 bars is 110.00 and the lowest low is 100.00, so the range is 10.00. The latest close is 103.00. Then %R = (110.00 minus 103.00) / (110.00 minus 100.00) x -100 = 7.00 / 10.00 x -100 = -70.
The close sits 70% of the way down from the top of the range, so the reading is -70. The same range produces different readings for different closes. The fast stochastic %K for each close is exactly 100 higher than the Williams %R reading, as the table shows.
| Latest close | Fast %K (position in range) | Williams %R | Band |
|---|---|---|---|
| 101.00 | 10 | -90 | Oversold band (-80 to -100) |
| 103.00 | 30 | -70 | Between the bands |
| 109.00 | 90 | -10 | Overbought band (0 to -20) |
Example: all prices are invented.
The same range can therefore produce a reading in either band. A reading of -10 does not show that the market will fall, and a reading of -90 does not show that it will rise. The indicator states only where the latest close sits inside the range.
The -20 and -80 levels are conventions. StockCharts describes readings from 0 to -20 as overbought and readings from -80 to -100 as oversold, with -50 as the centreline. The MetaTrader 5 help page uses the same bands. These labels describe position inside the lookback range. They are not a forecast.
StockCharts calls Williams %R the inverse of the Fast Stochastic Oscillator, and the two produce the exact same lines, but with different scaling. Working from the two formulas, Williams %R is the fast stochastic %K minus 100 over the same lookback, so both use the same high, low and close data. For how %K and %D are built, see the stochastic oscillator guide.
Williams %R uses only the last n bars of price. In a strong trend, the close can stay near the top or bottom of the range for many bars, so readings can remain in the overbought or oversold band for a long time. A reading in a band may reflect a sustained move rather than a turning point.
The lookback is a fixed count of bars, so a single spike in the high or low can shift the range for as long as it stays in the window. Changing the lookback changes the readings, which means two charts with the same market can show different levels. Check the input settings before comparing them.
The indicator does not include volume, the size of individual moves, or news. It does not identify the price levels where a trend might end. For levels, see support and resistance. For another range-based momentum oscillator built differently, see the Ultimate Oscillator guide.
This guide explains Williams %R in general and does not describe an RTX5 feature. No RTX5 release record confirms which indicators, chart types or alerts the product includes. Its Windows desktop client is in preview, and the web and mobile clients are planned. A Google Play listing for Android is published, but the mobile client has no approved release record yet; check the product-availability record before relying on any RTX5 feature.
Check RTX5 product availabilityTrust and methodology
We want you to be able to identify who owns the page, inspect the evidence, understand how tools were used, and challenge anything that looks wrong or out of date.
Published under the RTX5 Editorial Team byline. It identifies the responsible publishing organization; it does not imply that a named lawyer, regulator, financial adviser, or licensed expert approved this page.
4 primary references are listed on this page with context about what each one supports. The source set was checked on .
Automation and AI may help organize research, outline a page, or edit language. They are not treated as sources, are not presented as human experts, and do not remove the publisher's responsibility for the final page.
If a statement is incomplete, unsupported, or outdated, send the exact URL, sentence, and supporting evidence through our contact route. Read the full editorial and corrections policy.
Sources were checked on 10 November 2026. They explain market rules and concepts; they do not certify RTX5 or provide individual financial advice.
Williams %R is (Highest High minus Close) divided by (Highest High minus Lowest Low), multiplied by -100, over a lookback period. StockCharts uses 14 periods by default. The result runs from 0 to -100: a close at the top of the range reads near 0, and a close at the bottom reads near -100. Check your platform's input settings, because the period can be changed.
Yes. Williams R, Williams %R and the williams percent range all refer to the oscillator developed by Larry Williams. MetaTrader 5 calls it Williams' Percent Range. Spelling and naming differ between sites, but the sources checked for this guide describe the same structure and the same 0 to -100 scale.
They are conventional bands. Readings from 0 to -20 are called overbought, and readings from -80 to -100 are called oversold, according to StockCharts and the MetaTrader 5 help. The labels describe where the latest close sits within the lookback range. They do not show that a reversal will follow, and a reading can stay in a band for a long time during a trend.
Williams %R is the fast stochastic %K minus 100 over the same lookback, so both use the same high, low and close data, on a 0 to -100 scale rather than 0 to 100. The stochastic oscillator guide covers %K, %D and the slow versions.
No. Williams %R describes where the latest close sits inside a fixed number of past bars. It does not forecast prices, and this guide does not present any reading as a tested signal or a method that works. Treat it as a description of recent price position, and check the limits in a trend before drawing any conclusion from it.