Accountable publisher
Published under the RTX5 Editorial Team byline. It identifies the responsible publishing organization; it does not imply that a named lawyer, regulator, financial adviser, or licensed expert approved this page.
Momentum indicators
The know sure thing indicator, or KST, is a momentum oscillator developed by Martin Pring and first described in 1992. It takes four rate-of-change lines, smooths each one with a simple moving average, weights them 1, 2, 3 and 4, and sums them. A 9-period moving average of that sum is the signal line.
In brief
The KST is Martin Pring's momentum oscillator. It combines four smoothed rate-of-change lines, weights them, and compares the total with a signal line. Here is how it is built, how it is read, and where it misleads.
The KST starts from four rate-of-change (ROC) lines. A ROC measures the percentage change in price over a set number of bars. TA-Lib defines each one as (price at bar t divided by the price X bars earlier, minus 1), multiplied by 100. Pring used four horizons, so the KST looks at short, intermediate and longer-term momentum in one line.
Each ROC is then smoothed with a simple moving average (SMA). StockCharts calls the smoothed lines RCMA1 to RCMA4. The four lines are added with weights of 1 to 4, so the longest horizon carries the most weight in the total. The table gives the default periods from the sources checked for this guide.
| Component | Rate-of-change period | Smoothing SMA period | Weight |
|---|---|---|---|
| RCMA1 | 10 | 10 | 1 |
| RCMA2 | 15 | 10 | 2 |
| RCMA3 | 20 | 10 | 3 |
| RCMA4 | 30 | 15 | 4 |
| Signal line | KST line | 9 | Not weighted |
Defaults from StockCharts ChartSchool and TradingView support, checked 10 November 2026. TA-Lib gives the same ROC and SMA periods.
In full, KST = (RCMA1 × 1) + (RCMA2 × 2) + (RCMA3 × 3) + (RCMA4 × 4). The signal line is a 9-period SMA of the KST, not of price. Each figure in the sum is a weighted value, so a large move in the 30-period leg moves the KST more than the same move in the 10-period leg.
StockCharts calls KST simply a weighted average of four different rate-of-change values that have been smoothed, but TA-Lib states that nothing divides by the total of the weights. This guide follows the weighted sum.
Pring's KST is usually written as KST(ROC1, ROC2, ROC3, ROC4, SMA1, SMA2, SMA3, SMA4, signal). The standard set is 10, 15, 20, 30, 10, 10, 10, 15 and 9. StockCharts also lists weekly and monthly settings, labelled medium-term and long-term. They apply the same method to weekly or monthly bars, with different period numbers. The sources do not all give the same signal period for the daily chart, so the table shows each one.
| Source | Settings written as KST(...) | What the source states |
|---|---|---|
| StockCharts, daily (default) | KST(10,15,20,30,10,10,10,15,9) | The standard set, with a 9-period signal line |
| StockCharts, weekly | KST(10,13,15,20,10,13,15,20,9) | Pring's medium-term set, with a 9-period signal line |
| StockCharts, monthly | KST(9,12,18,24,6,6,6,9,9) | Pring's long-term set, with a 9-period signal line |
| TradingView support | KST(10,15,20,30,10,10,10,15,9) | Calls these the default parameters, says the time frames are at the trader's discretion, and reports that Pring recommended switching settings between daily, weekly and monthly charts |
| TA-Lib | ROC 10, 15, 20, 30; SMA 10, 10, 10, 15; signal 9 | Notes that Pring's daily page uses a 10-day signal, and gives a default signal period of 9 |
Verified on 10 November 2026 from the pages named. The weekly and monthly sets appear on StockCharts and the TradingView support page. Check your platform's inputs, because each one can differ.
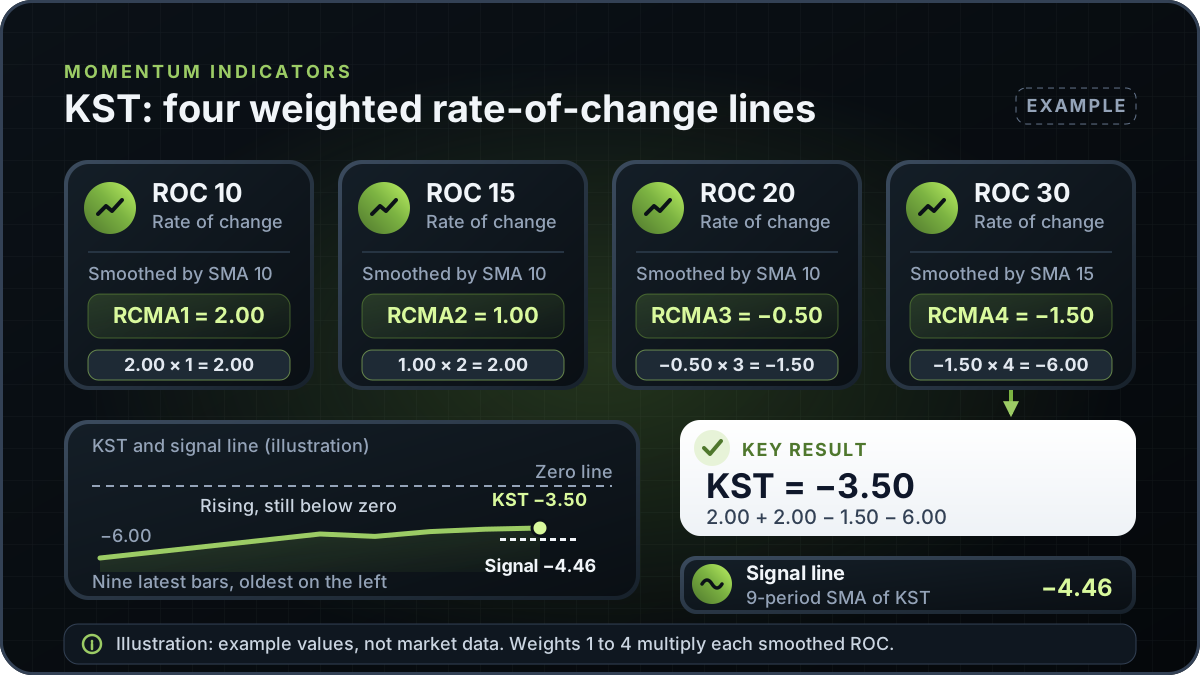
This is an illustrative example with invented values, not market data. Suppose the four smoothed ROC lines on the latest bar read RCMA1 = 2.00, RCMA2 = 1.00, RCMA3 = -0.50 and RCMA4 = -1.50, all in percent. Each weighted value is the smoothed reading multiplied by its weight, and the KST is their sum.
| Component | Smoothed value | Weight | Weighted value |
|---|---|---|---|
| RCMA1 | 2.00 | 1 | 2.00 |
| RCMA2 | 1.00 | 2 | 2.00 |
| RCMA3 | -0.50 | 3 | -1.50 |
| RCMA4 | -1.50 | 4 | -6.00 |
| KST (sum) | Not applicable | Total weight 10 | -3.50 |
Example: all values are invented. The sum is not divided by the total weight of 10.
KST = 2.00 + 2.00 - 1.50 - 6.00 = -3.50. The weighted total is negative in this example. Because the sum is not divided by 10, the value stays on the scale of the rate-of-change values multiplied by their weights, which is why KST readings are not comparable with a bounded oscillator.
The signal line is the 9-period SMA of KST. Suppose the nine most recent KST values, oldest first, are -6.00, -5.50, -5.00, -4.50, -4.00, -4.20, -3.80, -3.60 and -3.50. Their sum is -40.10, and -40.10 divided by 9 is -4.46 to two decimal places. The latest KST of -3.50 is above that signal of -4.46.
Over these nine bars the KST rises from -6.00 to -3.50. StockCharts describes a rising KST that is still negative as a sign that downside momentum is waning. In this example that describes the numbers given. It does not show what price will do next.
The two usual readings are a crossing of the zero line and a crossing of the signal line. StockCharts says KST generally rises when it is above its signal line and falls when it is below. It describes a positive KST as favouring bulls and a negative KST as favouring bears.
For its weekly and monthly settings, StockCharts says chartists should use signal line crossovers to detect directional changes in price, and that the lag for centreline crossovers is often too great. It also says it is probably best to use divergences when there is a large and blatant divergence. This guide does not present any of these readings as a method that works.
StockCharts says KST is not a perfect indicator and should be combined with other analysis. The smoothing step is an averaging method, and the exponential moving average guide explains a different average. For a bounded momentum oscillator built from the high and low range, see the stochastic oscillator guide.
Other rate-of-change tools handle the same input differently. The TRIX guide takes a triple-smoothed EMA and plots its one-period percent change, and the Coppock Curve guide applies a 10-period weighted moving average to the sum of a 14-period and an 11-period rate of change. Each has its own formula, so do not read one with the KST's settings.
This guide explains the know sure thing indicator in general and does not describe an RTX5 feature. No RTX5 release record confirms which indicators, chart types or alerts the product includes. Its Windows desktop client is in preview, and the web and mobile clients are planned. A Google Play listing for Android is published, but the mobile client has no approved release record yet; check the product-availability record before relying on any RTX5 feature.
Check RTX5 product availabilityTrust and methodology
We want you to be able to identify who owns the page, inspect the evidence, understand how tools were used, and challenge anything that looks wrong or out of date.
Published under the RTX5 Editorial Team byline. It identifies the responsible publishing organization; it does not imply that a named lawyer, regulator, financial adviser, or licensed expert approved this page.
4 primary references are listed on this page with context about what each one supports. The source set was checked on .
Automation and AI may help organize research, outline a page, or edit language. They are not treated as sources, are not presented as human experts, and do not remove the publisher's responsibility for the final page.
If a statement is incomplete, unsupported, or outdated, send the exact URL, sentence, and supporting evidence through our contact route. Read the full editorial and corrections policy.
Sources were checked on 10 November 2026. They explain market rules and concepts; they do not certify RTX5 or provide individual financial advice.
KST is (RCMA1 × 1) + (RCMA2 × 2) + (RCMA3 × 3) + (RCMA4 × 4). Each RCMA is a simple moving average of a rate of change: a 10-period SMA of a 10-period ROC, a 10-period SMA of a 15-period ROC, a 10-period SMA of a 20-period ROC, and a 15-period SMA of a 30-period ROC. The signal line is a 9-period SMA of KST.
Martin Pring created it. StockCharts says he first described it in 1992, in an article titled Summed Rate of Change (KST) in Stocks & Commodities magazine. TradingView's support page gives the same developer and year, and describes the indicator as introduced in Stocks & Commodities. The article title includes the KST abbreviation.
The standard set is KST(10,15,20,30,10,10,10,15,9): four rate-of-change periods, four smoothing periods and a 9-period signal line. StockCharts also gives weekly and monthly sets. TA-Lib notes that Pring's daily page uses a 10-day signal, while the charting platforms default to 9, so check the inputs on your own platform.
No. This guide does not present any crossover as a signal that works. TradingView's support page says signal-line crossovers can signify an underlying change in momentum. A crossover uses past prices only, so it cannot show what price will do next, and zero-line crossovers can lag.
TA-Lib's notes say nothing divides the KST by the sum of its weights, and the KST has no fixed upper or lower bound. Its size depends on the size of the four smoothed rate-of-change values. StockCharts says it is therefore relatively ill-suited to overbought and oversold readings. A value on one instrument or timeframe does not compare directly with the same value elsewhere.