Accountable publisher
Published under the RTX5 Editorial Team byline. It identifies the responsible publishing organization; it does not imply that a named lawyer, regulator, financial adviser, or licensed expert approved this page.
Trading indicators
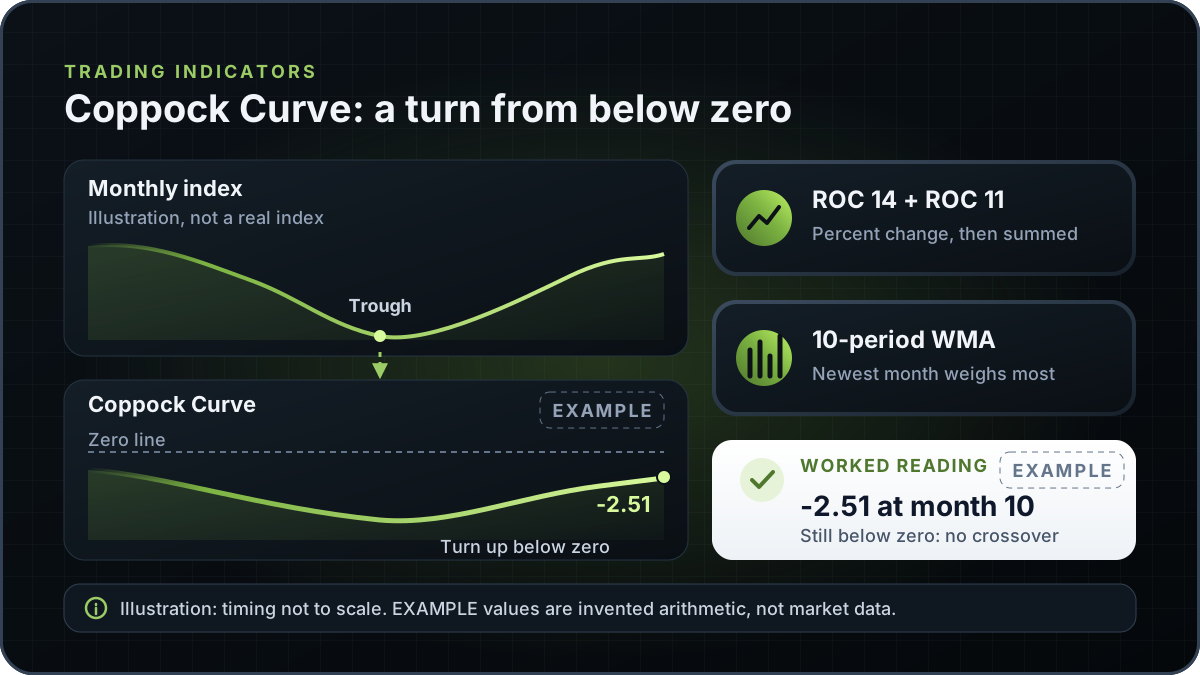
The Coppock Curve is a long-term momentum indicator that Edwin Coppock built to identify long-term buying opportunities in stock indexes. It is a 10-period weighted moving average of the sum of a 14-period and an 11-period rate of change, usually written as (14, 11, 10). Its zero-line crosses describe past momentum; they do not forecast a turn.
In brief
The Coppock Curve turns two rate-of-change readings into one long-term line. Here is how it is calculated, which settings the sources give, a worked weighted-average example, and why its rare signals are a limit to weigh, not a strength.
The Coppock Curve belongs to the family of rate-of-change indicators, which compare today's close with a close some periods earlier. StockCharts describes Edwin 'Sedge' Coppock as an economist by training, and says his original goal was to identify long-term buying opportunities in the S&P 500 and Dow Industrials. TradingView describes the tool as a price momentum indicator for determining major lows in the stock market.
The dates differ between sources. TradingView says the formula was developed in 1962 and first appeared in Barron's that year. StockCharts says Coppock introduced the indicator in Barron's in October 1965. This guide does not settle the question. Check the original Barron's issue before you quote a year.
For a shorter-cycle comparison, see the stochastic oscillator, which compares the close with a recent range, and what is MACD, which uses moving averages.
ROC 14 = 100 × (close − close 14 periods ago) ÷ close 14 periods ago. StockCharts gives the rate-of-change formula in this form.
ROC 11 uses the same formula with 11 periods. The two readings are added together, which gives one sum for each bar.
The sum is smoothed with a 10-period weighted moving average (WMA). StockCharts says a weighted moving average places more weight on recent values, so the newest bar counts most in the result.
In one line: Coppock Curve = WMA 10 of (ROC 14 + ROC 11). TradingView gives the same two rate-of-change lengths and a 10-month weighted average, but it does not print the full combination.
StockCharts says the indicator is calculated by default with 14- and 11-period rate-of-change inputs and a 10-period weighted moving average, which gives (14, 11, 10). Its daily S&P 100 example uses (20, 10, 10), which StockCharts says makes the curve a little less sensitive and may suit daily charts better.
| Source | Setting or date | What it says | How to read it here |
|---|---|---|---|
| StockCharts ChartSchool | (14, 11, 10) | Default calculation: 14- and 11-period ROC and a 10-period WMA; Coppock used monthly data to identify buying opportunities | The default used on this page |
| StockCharts ChartSchool | (20, 10, 10), daily | Example on S&P 100 daily data, described as a little less sensitive | A timeframe example, not a second default |
| StockCharts ChartSchool | October 1965 | Coppock introduced the indicator in Barron's in October 1965 | Differs from the 1962 date in TradingView |
| TradingView support | 11 and 14 rate-of-change inputs, 10 WMA | Gives the lengths but no defaults; ROC in periods, WMA in months | Consistent with (14, 11, 10); check the units on your platform |
| TradingView support | 1962 | Formula developed in 1962 by Edwin S. Coppock and first appeared in Barron's that year | Differs from the StockCharts date |
Verified on 10 November 2026 from the StockCharts and TradingView pages listed under sources.
This example is arithmetic on invented sums, labelled as an example. Each row is one month's ROC 14 plus ROC 11 value. Month 10, the newest, gets weight 10, and month 1, the oldest, gets weight 1. The weights add up to 55, which is the divisor.
| Month | Weight | ROC 14 + ROC 11 | Weight × value |
|---|---|---|---|
| 1 (oldest) | 1 | -6.0 | -6.0 |
| 2 | 2 | -5.0 | -10.0 |
| 3 | 3 | -4.5 | -13.5 |
| 4 | 4 | -4.0 | -16.0 |
| 5 | 5 | -3.5 | -17.5 |
| 6 | 6 | -3.0 | -18.0 |
| 7 | 7 | -2.5 | -17.5 |
| 8 | 8 | -2.0 | -16.0 |
| 9 | 9 | -1.5 | -13.5 |
| 10 (newest) | 10 | -1.0 | -10.0 |
| Total | 55 | -138.0 |
Example: -138.0 ÷ 55 = -2.509, shown as -2.51. The 1 to 10 weights are an arithmetic convention for this example. StockCharts gives a linear pattern only for a three-period WMA (the first value times one, the second times two, the third times three) and does not print the 10-period weights, so check the weighting on your platform.
In this example the curve reads -2.51 at month 10, still below the zero line. Under StockCharts' rule, a buy signal needs a cross up into positive territory, so this reading gives none.
StockCharts reads the zero line in two directions. A buy signal triggers with a cross into positive territory, and a sell signal triggers with a cross into negative territory. Coppock focused exclusively on buy signals. Many technical analysts add the sell signal, and StockCharts says those sell signals are not always as reliable as the buys.
StockCharts' own examples include the 2016 dip into negative territory, which did not go very far below the zero line, and 2022, when the S&P 500 trend turned up almost as soon as the curve turned negative. These are illustrations from one source, not a test of the indicator.
The curve and price can disagree before a crossover. StockCharts says more aggressive chartists can look for bullish and bearish divergences to anticipate such crossovers, but that divergences do not always result in trend reversals. It advises using Coppock Curve signals in conjunction with other technical analysis.
StockCharts says Coppock used monthly data to identify buying opportunities. It says that using monthly data the indicator 'will not trigger very many signals', and that the weekly chart produces many more signals.
Changing the settings changes the curve, so do not compare readings made with different settings.
| Misread | What the curve shows | Better reading |
|---|---|---|
| A curve below zero is a buy signal | The curve is negative; StockCharts's buy signal is a cross up into positive territory | Check the cross, not the level alone |
| The first upturn marks the market bottom | The curve is smoothed and built from past closes, so a turn can appear after prices have moved | Treat the turn as a description, not a bottom call |
| The monthly settings work the same on daily charts | Settings differ by timeframe, as the settings section shows | State which settings and timeframe you used |
| A sell cross always means sell | StockCharts says sell signals are not always as reliable as buy signals | Read the cross with price and other tools |
Next, read the stochastic oscillator guide to compare a shorter-cycle momentum tool, and keep these limits in mind when you read either one.
This guide explains the Coppock Curve in general and does not describe an RTX5 feature. No RTX5 release record confirms which indicators, chart types or alerts the product includes. Its Windows desktop client is in preview, and the web and mobile clients are planned. A Google Play listing for Android is published, but the mobile client has no approved release record yet; check the product-availability record before relying on any RTX5 feature.
Check RTX5 product availabilityTrust and methodology
We want you to be able to identify who owns the page, inspect the evidence, understand how tools were used, and challenge anything that looks wrong or out of date.
Published under the RTX5 Editorial Team byline. It identifies the responsible publishing organization; it does not imply that a named lawyer, regulator, financial adviser, or licensed expert approved this page.
5 primary references are listed on this page with context about what each one supports. The source set was checked on .
Automation and AI may help organize research, outline a page, or edit language. They are not treated as sources, are not presented as human experts, and do not remove the publisher's responsibility for the final page.
If a statement is incomplete, unsupported, or outdated, send the exact URL, sentence, and supporting evidence through our contact route. Read the full editorial and corrections policy.
Sources were checked on 10 November 2026. They explain market rules and concepts; they do not certify RTX5 or provide individual financial advice.
The Coppock Curve is a momentum indicator for stock indexes. StockCharts says Edwin Coppock's original goal was to identify long-term buying opportunities in the S&P 500 and Dow Industrials, and TradingView says it suits long-term strategies on indexes, ETFs and other liquid instruments rather than intraday trading. It describes past price momentum, so a turn can show only after the market has already moved.
StockCharts gives (14, 11, 10): a 14-period and an 11-period rate of change, summed, then smoothed by a 10-period weighted moving average. Its daily example uses (20, 10, 10), which it describes as a little less sensitive. TradingView lists the same inputs but no defaults, so check your platform's settings before you compare readings.
StockCharts describes a cross up into positive territory as a buy signal, and says Coppock focused exclusively on buy signals. A zero-line cross is a rule for reading a chart, not a forecast. StockCharts advises using Coppock Curve signals in conjunction with other technical analysis.
TradingView says the formula was developed in 1962, and StockCharts says Coppock introduced the indicator in Barron's in October 1965. The cited sources do not reconcile the two dates, so check the original Barron's issue before you quote a year.
No. TradingView describes the tool as a way to determine major lows, but the curve is built from past closes and smoothed, so it can show a turn only after prices have moved. StockCharts advises using it with other technical analysis. No reading is a promise of a result.