Accountable publisher
Published under the RTX5 Editorial Team byline. It identifies the responsible publishing organization; it does not imply that a named lawyer, regulator, financial adviser, or licensed expert approved this page.
Trading indicators
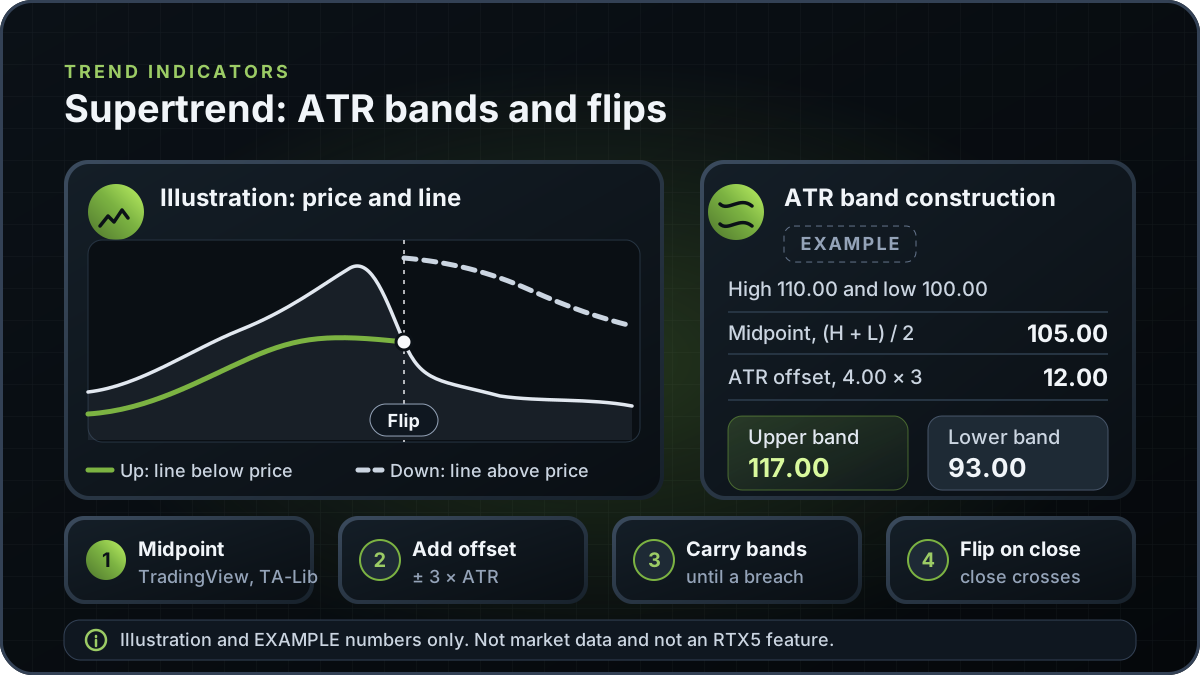
The Supertrend indicator is a trend-following overlay on price. It uses basic bands set around a source price, the bar midpoint in TradingView and TA-Lib, plus or minus a multiplier times Average True Range (ATR). The line follows the lower band in an uptrend and the upper band in a downtrend, and it flips when the close crosses it.
In brief
Supertrend is a trailing line built from ATR bands around a source price. Here is the formula, why implementations differ, a worked example and where the line lags.
The Supertrend indicator is a trailing line drawn on the price chart. It is built from two bands, one above a source price and one below it. Each band sits a distance equal to a multiplier times the Average True Range (ATR). The indicator is credited to Olivier Seban, who is named as the creator in the TradingView support article, the TA-Lib documentation and the cTrader help page.
At any moment the line is one of the two bands. In an uptrend it follows the lower band, and in a downtrend it follows the upper band. When a close crosses the active band, the trend state changes and the line moves to the other side of price. This guide calls that change a flip. The average true range guide explains how ATR is measured. This page uses ATR only to set the width of the bands.
The basic bands use three inputs: the source price, the ATR value and the multiplier. The reference formulas are set out below.
The TradingView article names the midpoint hl2 and the ATR lookback atrLength, and it gives the same three formulas. TA-Lib calls the ATR period TimePeriod and gives a default of 10. The cTrader help page uses the same band structure with the period average in place of the midpoint. The multiplier default in both TA-Lib and cTrader is 3. The TradingView article states no defaults, so its values are whatever the user sets.
The basic bands are not drawn exactly as calculated. Each band is carried forward from bar to bar, so it moves in one direction until a close breaks through it. The rules below follow the TradingView and TA-Lib descriptions.
Some platforms colour the line green in an uptrend and red in a downtrend, as the TradingView article describes. The colour is a display choice. The trend state, which follows from the close and the carried bands, is what the flip depends on.
This is an Example. The prices, ATR value and multiplier are chosen to make the arithmetic easy to check. They are not taken from a market or an RTX5 feature.
| Item | Calculation | Example value |
|---|---|---|
| Bar midpoint, TradingView and TA-Lib form | (110.00 + 100.00) / 2 | 105.00 |
| ATR offset | 3 x 4.00 | 12.00 |
| Basic upper band | 105.00 + 12.00 | 117.00 |
| Basic lower band | 105.00 - 12.00 | 93.00 |
Example only. The bar has a high of 110.00 and a low of 100.00, the ATR length is 10 and the ATR value is 4.00, and the multiplier is 3. The midpoint is the TradingView and TA-Lib form.
Carry-forward example. On the next bar, suppose the previous upper band was 115.00 and the previous close was 113.00. The new basic upper band of 117.00 is not below 115.00, and the previous close did not close above 115.00. The upper band therefore stays at 115.00.
Flip example. Suppose the trend is down and the line is the upper band at 115.00. If the next close is 116.20, it is above 115.00, so the trend flips up. The line then follows the lower band.
The three cited references use the same three-part structure, but they do not state the same source price or inputs. A charting platform can also add its own settings. The table lists what each reference states.
| Reference | Source price | ATR length default | Multiplier default | ATR smoothing | Flip rule |
|---|---|---|---|---|---|
| TradingView support | hl2, the bar midpoint | Input atrLength; default not stated | Input multiplier; default not stated | Not stated on the page | Close above the upper band, or below the lower band |
| TA-Lib SuperTrend | Median price, (High + Low) / 2 | 10 (TimePeriod) | 3 | The period is the smoothing length of ATR | Close falls below Lower in an uptrend; close rises above Upper in a downtrend |
| cTrader built-in Supertrend | Average of the highest and lowest prices over the period | 10 periods | 3 | Not stated on the page | Price crossing the line, read as buy and sell signals |
Verified on 10 November 2026 from the three pages linked in the first section. Defaults are shown as each reference states them.
The source price differs most clearly in cTrader, which describes an average over a period rather than the midpoint of a single bar. ATR smoothing is the least clear point. The TA-Lib page ties the ATR period to smoothing, but none of the cited pages say whether ATR is a simple, exponential or Wilder average. Ask your platform before comparing two charts.
For a second view of trend direction, compare Supertrend with the Parabolic SAR guide and the Donchian and Keltner channels guide.
Charting platforms often let users change the source price, the ATR settings, the multiplier and the flip rule. Each change produces a different line, so the name Supertrend alone does not identify the calculation.
Write these inputs beside any chart, backtest or screenshot you share, so another reader can check the calculation. This guide does not describe a particular custom build and does not offer to create one.
Before you read a flip on your own chart, open the indicator settings and note the source price, ATR length and multiplier. Then read the trendline guide to compare the line with a drawn trend. Use the same settings on every chart you compare, and do not treat a flip as a prediction.
This guide explains the Supertrend indicator in general and does not describe an RTX5 feature. No RTX5 release record confirms which indicators, chart types or alerts the product includes. Its Windows desktop client is in preview, and the web and mobile clients are planned. A Google Play listing for Android is published, but the mobile client has no approved release record yet; check the product-availability record before relying on any RTX5 feature.
Check RTX5 product availabilityTrust and methodology
We want you to be able to identify who owns the page, inspect the evidence, understand how tools were used, and challenge anything that looks wrong or out of date.
Published under the RTX5 Editorial Team byline. It identifies the responsible publishing organization; it does not imply that a named lawyer, regulator, financial adviser, or licensed expert approved this page.
4 primary references are listed on this page with context about what each one supports. The source set was checked on .
Automation and AI may help organize research, outline a page, or edit language. They are not treated as sources, are not presented as human experts, and do not remove the publisher's responsibility for the final page.
If a statement is incomplete, unsupported, or outdated, send the exact URL, sentence, and supporting evidence through our contact route. Read the full editorial and corrections policy.
Sources were checked on 10 November 2026. They explain market rules and concepts; they do not certify RTX5 or provide individual financial advice.
The basic bands are a source price plus and minus a multiplier times ATR. In TradingView and TA-Lib the source price is the bar midpoint, (high + low) / 2. cTrader uses the average of the highest and lowest prices over the period. The final bands are carried forward. The upper band can move down, or reset up only after a close above it, and the lower band can move up, or reset down only after a close below it. The plotted line follows the lower band in an uptrend and the upper band in a downtrend.
TA-Lib and cTrader both state an ATR length of 10 and a multiplier of 3. The TradingView support article does not state defaults and leaves the ATR length and multiplier as inputs. Check the values on your own platform before comparing results, because a different setting produces a different line.
The TradingView, TA-Lib and cTrader references all name Olivier Seban as the creator or developer. The cTrader help page says the indicator was introduced in the early 2000s. The TradingView and TA-Lib pages give no date, so this guide does not verify that date. TA-Lib lists a book by Olivier Seban, Tout le monde mérite d'être riche (Maxima), with no year, so this guide cites no year for the indicator.
No. A flip shows that a close has crossed the active band and the trend state has changed. The cTrader page describes crossings as buy and sell signals, but a flip describes past closes only. It does not show that a trade will work, and this guide gives no win rate.
The multiplier scales the ATR offset from the source price. Because a higher multiplier places the bands further from price, a close needs a larger move to cross them, so flips can be less frequent and later. A lower multiplier keeps the bands closer and can produce more flips in a range. This follows from the basic band formula and is not a test result.
The formula needs high, low and close prices, so the calculation can be applied wherever those values exist. Its behaviour still depends on the instrument's volatility, the bar data your platform uses and the ATR settings. Read the chart with those inputs in mind, and treat the line as a description of past prices.