Accountable publisher
Published under the RTX5 Editorial Team byline. It identifies the responsible publishing organization; it does not imply that a named lawyer, regulator, financial adviser, or licensed expert approved this page.
Technical indicators
Parabolic SAR, also called parabolic stop and reverse or PSAR, is a trend-following indicator that J. Welles Wilder Jr. described in his 1978 book. It plots dots below price in an uptrend and above price in a downtrend, and each dot moves toward price by an accelerating factor. It describes past prices and does not forecast a reversal.
In brief
The parabolic SAR, or PSAR, is a trailing level drawn as dots. Here is how the formula moves those dots, when they flip, and why a range can make them flip too often.
Wilder introduced the parabolic time/price system in New Concepts in Technical Trading Systems (1978). StockCharts names him as the originator and gives the formulas below. The calculation uses the prior SAR value, an acceleration factor (AF), and an extreme point (EP) that records the best price reached in the current trend.
For a rising SAR, the current value equals the prior SAR plus the prior AF multiplied by the difference between the prior EP and the prior SAR. For a falling SAR, the current value equals the prior SAR minus the prior AF multiplied by the difference between the prior SAR and the prior EP. The MetaTrader 5 help page writes the formula differently. For long positions it gives "SAR (i) = SAR (i - 1) + ACCELERATION * (HIGH (i - 1) - SAR (i - 1))", and for short positions it uses LOW (i - 1) in place of HIGH (i - 1). Those bar prices take the place of StockCharts' extreme point. The MT5 page states no clamp and no parameter defaults, so this guide follows StockCharts for the EP and clamp rules.
| Term | What it means | Rule or default |
|---|---|---|
| SAR | The dot value for the bar | Rising: prior SAR + prior AF x (prior EP - prior SAR). Falling: prior SAR - prior AF x (prior SAR - prior EP) |
| AF (acceleration factor) | Sets how far each dot steps toward price | Starts at 0.02 and rises by 0.02 each time the EP makes a new high (uptrend) or a new low (downtrend) |
| AF maximum | Caps the step | 0.20, however long the trend runs |
| EP (extreme point) | The best price in the current trend | Uptrend: the highest high of the current uptrend. Downtrend: the lowest low of the current downtrend |
| Clamp | Stops a dot entering recent price | A rising SAR is never above the prior two lows, and a falling SAR is never below the prior two highs |
Source: StockCharts ChartSchool, Parabolic SAR. Checked 10 November 2026. The clamp and EP rules are paraphrased.
The defaults above come from StockCharts, which cites Wilder's 1978 book as the origin. The MetaTrader 5 help page uses a different form of the formula and lists no step or maximum values, so the table shows both differences rather than filling them in.
| Reference | Starting AF | AF step | AF maximum | Note |
|---|---|---|---|---|
| StockCharts ChartSchool | 0.02 | 0.02 | 0.20 | Cites Wilder (1978). Steps toward the extreme point (EP) and applies the two-bar clamp |
| MetaTrader 5 help | Not listed | Not listed | Not listed | Variant: uses HIGH (i - 1) or LOW (i - 1) in place of the EP, and starts from the previous period's maximum or minimum after a turn. States no clamp and no defaults |
Platform defaults can differ. Check the settings window in your own charting software before you read a dot.
This guide uses only the StockCharts defaults, because they are the figures that reference states. A change to any of the three factors changes every dot and every flip, so results from one setting do not carry over to another.
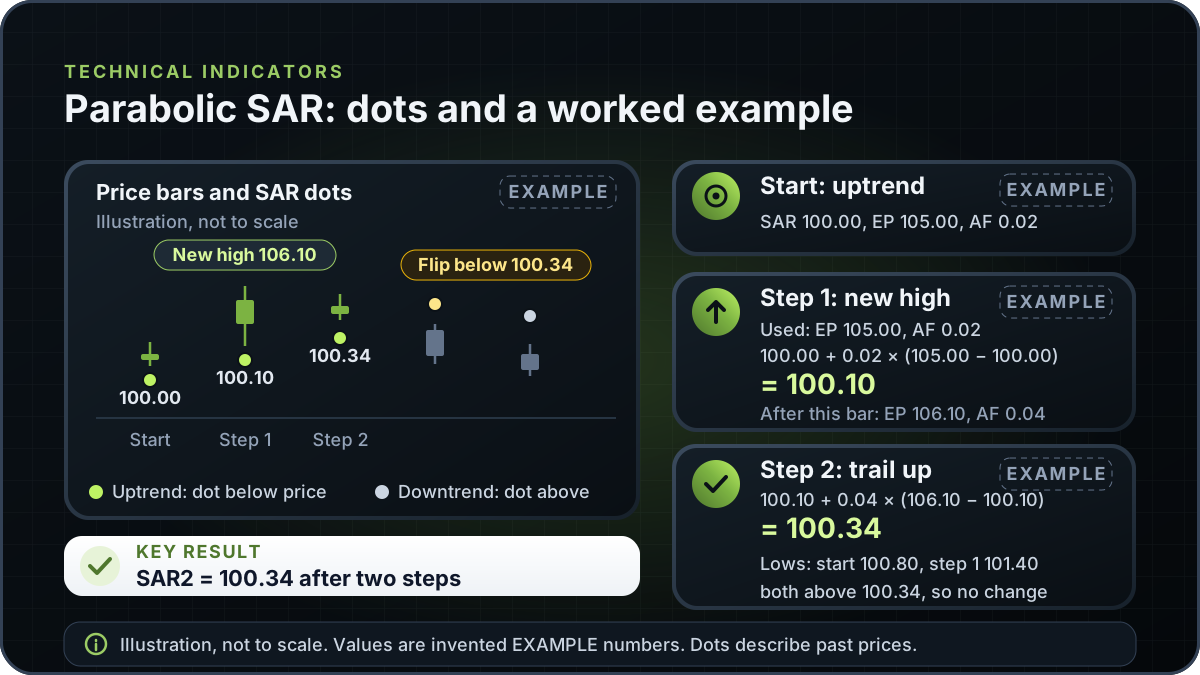
This is an Example with invented numbers. It is not a market record and it is not a trade. The start is an uptrend with SAR0 = 100.00, EP0 = 105.00 and AF0 = 0.02.
Example, step 1: SAR1 = 100.00 + 0.02 x (105.00 - 100.00) = 100.00 + 0.10 = 100.10. The clamp compares this with the lows of the start bar (100.80) and the bar before it (100.60). Both sit above 100.10, so the value stands. The step 1 bar then makes a new high of 106.10. That is a new extreme point, so EP becomes 106.10 and the factor steps up by 0.02 to 0.04.
Example, step 2: SAR2 = 100.10 + 0.04 x (106.10 - 100.10) = 100.10 + 0.24 = 100.34. The clamp now uses the lows of the start bar (100.80) and the step 1 bar (101.40). Both sit above 100.34, so the clamp does not change the value. The dot has moved from 100.00 to 100.34 over two bars, and the step is larger because the factor has risen.
A flip would follow if price closed through the dot. In this sequence, a fall below 100.34 would switch the SAR above price and start a downtrend. The new downtrend would use the falling formula and a fresh extreme point.
StockCharts says that once a trend reverses and starts to move in the new direction, the SAR follows price like a trailing stop. The MetaTrader 5 help page also says "It is often the case that the indicator serves as a trailing stop line." Supertrend is another trailing line, but it is built from average true range bands rather than an accelerating factor, so its flips and lag differ.
A dot is a chart value. It is not an order, and nothing on the chart closes a position. A stop order placed at a dot can fill away from it once triggered, as the stop-loss guide explains.
A whipsaw is a flip that reverses soon after it happens. The SAR keeps trailing price, so in a range the dots keep crossing price as it swings up and down. Each cross switches the side of the dot, and a trader who acts on every flip will act often.
StockCharts says the indicator is prone to whipsaws over 50% of the time or when a security is not trending. It is a general warning from one source, not a measured result. Example: over ten bars that drift sideways, four flips would mean four changes of direction, each of which could have closed a position under a flip-only rule.
Some traders add a trend-strength filter before they read the dots. The ADX guide covers one such measure. A filter may reduce the flips a rule acts on, but it does not stop whipsaws in every market, and it adds its own settings and lag.
This guide explains parabolic SAR in general and does not describe an RTX5 feature. No RTX5 release record confirms which indicators, chart types or alerts the product includes. Its Windows desktop client is in preview, and the web and mobile clients are planned. A Google Play listing for Android is published, but the mobile client has no approved release record yet; check the product-availability record before relying on any RTX5 feature.
Check RTX5 product availabilityTrust and methodology
We want you to be able to identify who owns the page, inspect the evidence, understand how tools were used, and challenge anything that looks wrong or out of date.
Published under the RTX5 Editorial Team byline. It identifies the responsible publishing organization; it does not imply that a named lawyer, regulator, financial adviser, or licensed expert approved this page.
3 primary references are listed on this page with context about what each one supports. The source set was checked on .
Automation and AI may help organize research, outline a page, or edit language. They are not treated as sources, are not presented as human experts, and do not remove the publisher's responsibility for the final page.
If a statement is incomplete, unsupported, or outdated, send the exact URL, sentence, and supporting evidence through our contact route. Read the full editorial and corrections policy.
Sources were checked on 10 November 2026. They explain market rules and concepts; they do not certify RTX5 or provide individual financial advice.
SAR stands for stop and reverse. The indicator is also called parabolic stop and reverse, or PSAR. StockCharts says Wilder introduced it as the Parabolic Time/Price System in his 1978 book.
In an uptrend, the next SAR equals the prior SAR plus the prior acceleration factor multiplied by the difference between the extreme point and the prior SAR. The factor starts at 0.02, rises by 0.02 each time the extreme point makes a new high, and stops at 0.20. A downtrend uses the mirror formula with the extreme low.
It flips when price crosses the dot. In an uptrend, price moving through the SAR switches the dot above price and starts a downtrend. The MetaTrader 5 help describes the turn as happening when price crosses the SAR line. Check your platform for the exact price field it uses, such as high, low or close.
StockCharts describes the SAR as following price like a trailing stop after a reversal, and the MetaTrader 5 help page says the indicator often serves as a trailing stop line. A dot is a chart value, though, not an order, and nothing on the chart closes a position. How a stop order placed at a dot is triggered and filled is covered in the stop-loss guide.
The indicator keeps trailing price, so in a range price keeps crossing the dots and the side flips again and again. StockCharts warns that the indicator is prone to whipsaws over 50% of the time or when a security is not trending. A trend-strength filter may reduce the flips a rule acts on, but it does not stop whipsaws in every market.
No. The dots are calculated from past prices, and a flip shows only that price has crossed the dot on the chart. A flip confirms a change in the chart rather than forecasting one. The indicator does not give a price target, a win rate or a timing signal.