Accountable publisher
Published under the RTX5 Editorial Team byline. It identifies the responsible publishing organization; it does not imply that a named lawyer, regulator, financial adviser, or licensed expert approved this page.
Trading indicators
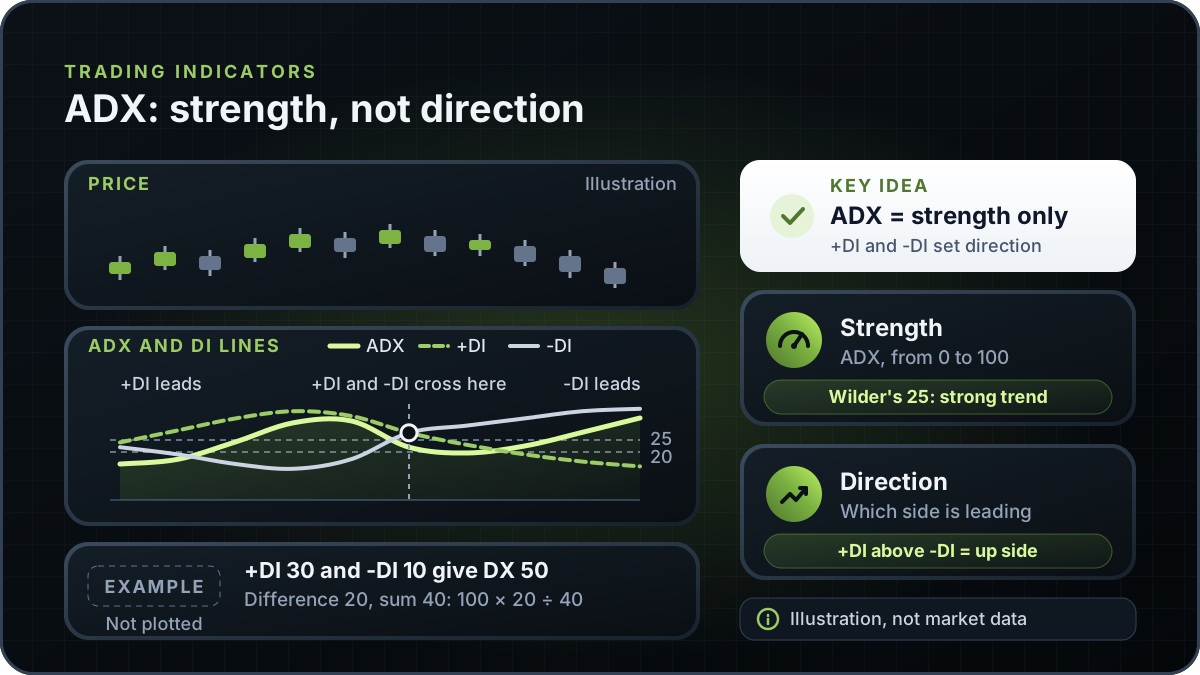
The ADX indicator, or Average Directional Index, is a trend-strength measure developed by J. Welles Wilder. It runs from 0 to 100 and rises when price movement is more directional. ADX does not show whether that movement is up or down; the +DI and -DI lines give direction.
In brief
ADX tells you how strong a trend is, not which way price is moving. Here is how it is built from directional movement, which thresholds are conventional, and where it misleads.
The ADX indicator belongs to the Directional Movement system that J. Welles Wilder set out in his 1978 book, New Concepts in Technical Trading Systems. For the wider background on how trends are read, see what is price action trading.
The name can mislead. ADX has no direction in it. It answers how strongly price has been trending over the lookback period. The +DI and -DI lines answer which side is stronger.
For each bar, +DM is the current high minus the prior high, counted only when it is positive and larger than the prior low minus the current low. Otherwise +DM is zero. -DM is the mirror image: the prior low minus the current low, counted only when it is positive and larger than the upward move.
TR is the greatest of three values: the current high minus the current low, the absolute value of the current high minus the prior close, and the absolute value of the current low minus the prior close. It is the same True Range used by the average true range indicator.
Smooth +DM, -DM and TR over 14 periods. +DI is 100 multiplied by the smoothed +DM and divided by the smoothed TR. -DI is the same calculation using smoothed -DM.
DX is 100 multiplied by the absolute difference between +DI and -DI, divided by the sum of +DI and -DI. It runs from 0 to 100 and is zero when the two lines are equal.
ADX is a 14-period average of DX, smoothed in the Wilder way described in the next section. The result is the trend-strength line.
StockCharts states that the default period is 14, as recommended by Wilder. In the Wilder smoothing, the first smoothed TR is the sum of the first 14 TR values. Each later value is the prior smoothed value, minus the prior value divided by 14, plus the current TR. The same 14-period structure carries through to ADX.
For ADX itself, the first value is a 14-period average of DX. Each later value is ((prior ADX × 13) + current DX) ÷ 14, so each new reading carries one-fourteenth of the weight.
StockCharts also notes that roughly 150 periods of data are needed before the smoothed values settle. A chart with fewer bars shows values that depend heavily on where the calculation started, so judge early readings with care.
The example below works DX from given DI readings. Each row is arithmetic only, not market data. Both readings are positive numbers: DX = 100 × (larger reading minus smaller reading) ÷ (larger reading plus smaller reading). StockCharts writes this as the absolute difference over the sum, times 100.
| Case | +DI | -DI | Difference | Sum | DX |
|---|---|---|---|---|---|
| Example A | 30 | 10 | 20 | 40 | 50.0 |
| Example B | 25 | 20 | 5 | 45 | 11.1 |
| Example C | 10 | 10 | 0 | 20 | 0.0 |
Example arithmetic. Case A: 100 × 20 ÷ 40 = 50.0. Case B: 100 × 5 ÷ 45 = 11.1 (rounded). Case C: the two lines are equal, so DX is zero.
Case A has a wide gap between the DI lines and a DX of 50. Case C has equal lines and a DX of zero. A high DX describes the spread between the lines, not where price will go.
Next, a smoothing step. With a prior ADX of 30 and a current DX of 36: ADX = ((30 × 13) + 36) ÷ 14 = 426 ÷ 14 = 30.43, rounded to two places. One new reading moves the smoothed value only a little.
StockCharts attributes to Wilder the view that a strong trend is present when ADX is above 25, and that no trend is present when ADX is below 20. It says there appears to be a grey zone between 20 and 25, and that many technical analysts use 20 as the key level. The source does not say how to classify readings in that band.
These are conventions for describing a trend, not buy or sell triggers. The table sets out the variants found in the references cited in this guide.
| Reference | Setting or level | What the reference says | How to read it here |
|---|---|---|---|
| StockCharts ChartSchool (Wilder) | Above 25 | A strong trend is present | Wilder's view, as cited by StockCharts |
| StockCharts ChartSchool (Wilder) | Below 20 | No trend is present | Same source |
| StockCharts ChartSchool | 20 to 25 | There appears to be a grey zone | The source does not say how to classify it |
| StockCharts ChartSchool (common practice) | 20 | Many analysts use 20 as the key level | A different cut-off from Wilder's 25 |
| StockCharts ChartSchool (default) | 14 periods | Default, as recommended by Wilder | The default period for the DI lines and ADX |
| MetaTrader 5 help: standard ADX | 14-period DI lines | Describes a 14-period comparison of +DI and -DI, with a formula as an N-period average of the normalised difference | Uses a 14-period +DI and -DI comparison; the page does not label it a default; no level is stated |
| MetaTrader 5 help: Wilder variant | Period input, no default stated | Built as a strict correspondence with Wilder's algorithm; its ATR line is smoothed with a smoothed moving average | The default must be checked on the platform |
Verified on 10 November 2026 from the StockCharts ChartSchool and MetaTrader 5 help pages listed under sources.
ADX gives the strength of the movement. The +DI and -DI lines give its side. When +DI sits above -DI, upward directional movement has been larger over the lookback. When -DI sits above +DI, downward movement has been larger.
MetaTrader 5 documents a crossover rule attributed to Wilder. This guide does not set out entries or exits, and no test of that rule is cited here.
A useful reading order is direction from the DI lines, strength from ADX, and then context from the price chart. For a broader view of momentum, compare with what is MACD, which answers a different question.
| Misread | What the indicator actually shows | Better reading |
|---|---|---|
| A rising ADX means price is going up | ADX rises when directional movement grows, whichever way price moves | Check the +DI and -DI lines for direction |
| An ADX above 25 is a buy or sell signal | It describes trend strength over the lookback period | Treat it as context, not a trigger |
| A falling ADX means the trend has reversed | A falling ADX means strength is fading or the market is flattening | Price can keep moving the same way while ADX falls |
| A low ADX means price is calm | A low ADX means little directional movement, not a small price range | Sideways markets can still have wide bars and large swings |
| Changing the period only changes the speed | The period sets the smoothing. At the 14-period default StockCharts gives, ADX = ((prior ADX × 13) + current DX) ÷ 14, so each new DX carries one-fourteenth of the weight | A different period changes every value on the chart; compare settings before choosing one |
| ADX is reliable from the first bar | Smoothed values need a long run of data to settle, around 150 periods per StockCharts | Ignore early values on a new chart or after a data gap |
This guide explains the ADX indicator in general and does not describe an RTX5 feature. No RTX5 release record confirms which indicators, chart types or alerts the product includes. Its Windows desktop client is in preview, and the web and mobile clients are planned. A Google Play listing for Android is published, but the mobile client has no approved release record yet; check the product-availability record before relying on any RTX5 feature.
Check RTX5 product availabilityTrust and methodology
We want you to be able to identify who owns the page, inspect the evidence, understand how tools were used, and challenge anything that looks wrong or out of date.
Published under the RTX5 Editorial Team byline. It identifies the responsible publishing organization; it does not imply that a named lawyer, regulator, financial adviser, or licensed expert approved this page.
5 primary references are listed on this page with context about what each one supports. The source set was checked on .
Automation and AI may help organize research, outline a page, or edit language. They are not treated as sources, are not presented as human experts, and do not remove the publisher's responsibility for the final page.
If a statement is incomplete, unsupported, or outdated, send the exact URL, sentence, and supporting evidence through our contact route. Read the full editorial and corrections policy.
Sources were checked on 10 November 2026. They explain market rules and concepts; they do not certify RTX5 or provide individual financial advice.
No. The ADX indicator measures how strong a trend is, on a scale from 0 to 100. Direction comes from comparing the +DI and -DI lines. Wilder's directional movement system is built from both parts, but ADX on its own does not show whether price is rising or falling.
StockCharts gives 14 periods as the default, as recommended by J. Welles Wilder in New Concepts in Technical Trading Systems (1978). The MetaTrader 5 help page for the standard indicator also uses a 14-period comparison of the DI lines. Some platforms let you change the period, and a different period changes every value on the chart.
No. StockCharts attributes to Wilder the view that a strong trend is present when ADX is above 25. That describes the trend over past bars. It does not show that the trend will continue, and it is not a signal to enter or exit a trade.
StockCharts says there appears to be a grey zone between 20 and 25, notes that many technical analysts use 20 as the key level, and attributes the 25 level to Wilder as the point for a strong trend. The disagreement shows that these are conventions. Check which level your source uses before you compare readings.
No. ADX describes past price movement, and it can stay high during a trend that reverses, and it can fall after a trend has ended. It does not remove trading risk. Keep your own risk limits, and use the position size calculator to set the amount at risk before any trade.