Accountable publisher
Published under the RTX5 Editorial Team byline. It identifies the responsible publishing organization; it does not imply that a named lawyer, regulator, financial adviser, or licensed expert approved this page.
Technical indicators
The Aroon indicator is a technical measure developed by Tushar Chande in 1995. It counts the bars since the highest high and the lowest low in a window (25 bars in the StockCharts formulas) and scales each count from 0 to 100. Aroon Up and Aroon Down are the two lines, and their difference is the Aroon oscillator.
In brief
The Aroon indicator measures timing, not price distance. Here are the Aroon Up, Aroon Down and oscillator formulas, a worked example with assumed numbers, a table of readings, and the limits that apply.
The Aroon indicator was developed by Tushar Chande in 1995, according to the StockCharts ChartSchool Aroon entry. It does not average prices the way a moving average does. It counts how many bars have passed since the highest high and the lowest low inside a fixed window.
That makes Aroon a timing measure. A new high that is only slightly above the old one resets the count in the same way as a large breakout, because Aroon reads only how long ago the extreme occurred. For a measure of trend strength built on directional movement, see the ADX indicator. For a comparison of the close with a recent range, see the stochastic oscillator.
The standard formulas use a window of N periods. Each line counts the bars since the extreme inside that window, one for the highest high and one for the lowest low. StockCharts describes N = 25 as its default parameter.
With N = 25, the formulas become Aroon Up = 100 x (25 - Days Since 25-day High) / 25 and Aroon Down = 100 x (25 - Days Since 25-day Low) / 25. StockCharts uses Days Since to mean bars since the extreme. A count of 0 means the high or low is on the latest bar, which gives 100. A count of 25 means the extreme is at the edge of the window, which gives 0.
Because 100 divided by 25 is 4, each bar since the extreme lowers the reading by 4 points at N = 25.
The Aroon oscillator subtracts Aroon Down from Aroon Up. The StockCharts ChartSchool Aroon Oscillator entry defines it as Aroon-Up minus Aroon-Down, with a range from -100 to +100 and zero as the midpoint. The same page gives 25 periods as the default.
A positive value means Aroon Up is higher, so the most recent extreme in the window is a high. A negative value means the most recent extreme is a low. Some platforms draw the oscillator in its own panel and some do not, so confirm the definition in your software before you compare values.
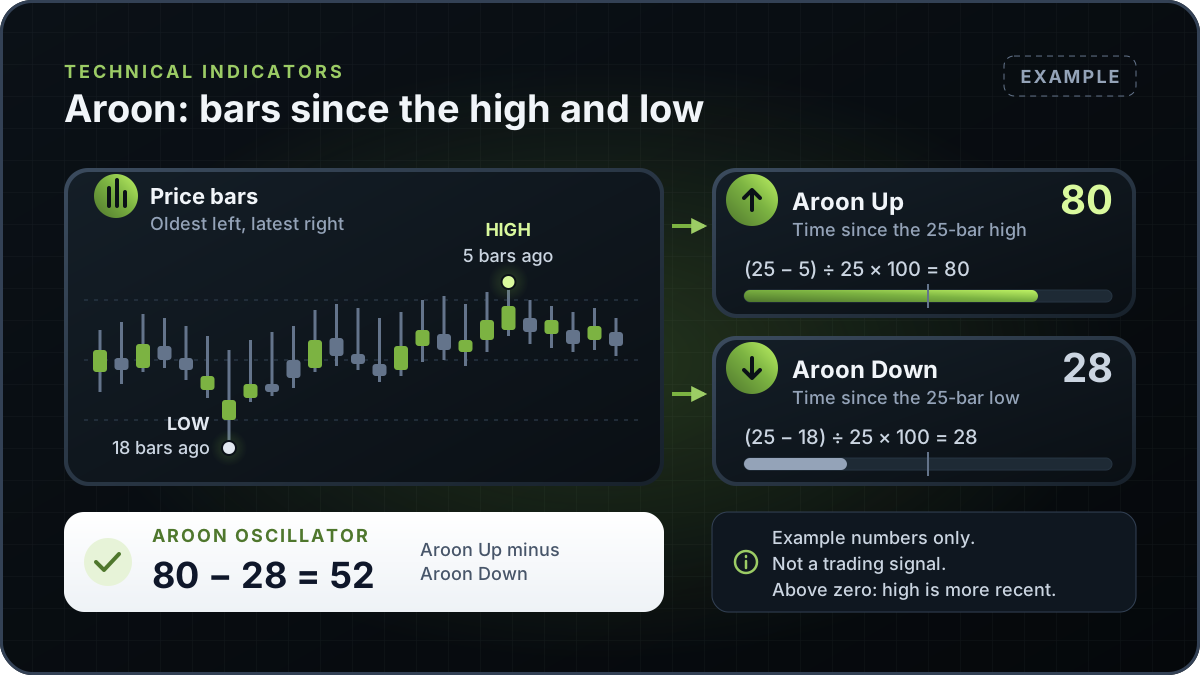
This is an Example with assumed numbers, not a chart of a real instrument. The window ends on the current bar, and the bar count starts at 0 on that bar. The diagram uses the same figures.
Example: the highest high in the 25-bar window occurred 5 bars ago.
Example: (25 - 5) / 25 x 100 = 80.
Example: the lowest low occurred 18 bars ago.
Example: (25 - 18) / 25 x 100 = 28.
Example: 80 - 28 = 52. The result is positive, so in this Example the most recent extreme is the high.
The result describes this window only. It does not say what the price will do next.
The table applies the formula above to a range of bar counts, so you can check your own readings by hand.
| Bars since the extreme | Aroon value | How to read the value |
|---|---|---|
| 0 | 100 | The high or low is on the latest bar |
| 5 | 80 | Recent extreme, the same count as the worked example high |
| 12 | 52 | Still above the 50 centreline |
| 13 | 48 | Just below the 50 centreline |
| 18 | 28 | An older extreme, in the lower part of the scale |
| 25 | 0 | The extreme is at the edge of the window |
Calculated with the formula in this guide at N = 25. The right-hand column describes the scale and does not state what price will do next.
References do not always agree on the period, so record the setting whenever you compare readings. The formulas in this guide use 25, the default that StockCharts gives. TradingView's support article leaves the period to the trader and uses a 14-day window in its example, and a different period changes every reading.
| Reference | Default period | What the reference states |
|---|---|---|
| StockCharts ChartSchool, Aroon | 25 | Formulas use 25 days, the default SharpCharts parameter, and attribute the indicator to Tushar Chande in 1995 |
| StockCharts ChartSchool, Aroon Oscillator | 25 | Oscillator is Aroon-Up minus Aroon-Down, with a default of 25 periods |
| TradingView support, Aroon | No default stated; 14 days in its example | Says the calculation relies on a user-defined period and attributes the indicator to Tushar Chande in 1995 |
Checked on 10 November 2026 against the three pages listed in this table.
The window also changes the scale. With N = 14, a high 5 bars ago gives Example: (14 - 5) / 14 x 100 = 64.3 under the same formula, compared with 80 at N = 25. Use the input your platform shows, and state which value you used whenever you describe a reading.
StockCharts describes several reading zones. They are conventions for talking about the scale. They are not tests that a trade will work, and the sources do not give success rates for them.
The StockCharts wording describes past bars only. Consistently high readings mean prices are regularly making new highs or lows, which is not a forecast, and the pattern can fail. Compare the reading with the price chart and with the window length before you draw any conclusion.
Before you compare an Aroon reading with another chart, confirm four things: the period N, the price source used for highs and lows, whether the oscillator is shown, and the time frame. Write these settings beside any screenshot or note.
A single indicator reading is one input to a trade plan, not the plan itself. The risk-reward ratio and the position size calculator help you check the arithmetic of a trade before you take it.
This guide explains the Aroon indicator in general and does not describe an RTX5 feature. No RTX5 release record confirms which indicators, chart types or alerts the product includes. Its Windows desktop client is in preview, and the web and mobile clients are planned. A Google Play listing for Android is published, but the mobile client has no approved release record yet; check the product-availability record before relying on any RTX5 feature.
Check RTX5 product availabilityTrust and methodology
We want you to be able to identify who owns the page, inspect the evidence, understand how tools were used, and challenge anything that looks wrong or out of date.
Published under the RTX5 Editorial Team byline. It identifies the responsible publishing organization; it does not imply that a named lawyer, regulator, financial adviser, or licensed expert approved this page.
4 primary references are listed on this page with context about what each one supports. The source set was checked on .
Automation and AI may help organize research, outline a page, or edit language. They are not treated as sources, are not presented as human experts, and do not remove the publisher's responsibility for the final page.
If a statement is incomplete, unsupported, or outdated, send the exact URL, sentence, and supporting evidence through our contact route. Read the full editorial and corrections policy.
Sources were checked on 10 November 2026. They explain market rules and concepts; they do not certify RTX5 or provide individual financial advice.
The Aroon indicator is a technical measure developed by Tushar Chande in 1995. It counts the bars since the highest high and the lowest low in a window (25 bars in the StockCharts formulas) and scales each count from 0 to 100. It describes the timing of recent extremes. It does not measure price distance or forecast direction.
Aroon Up equals 100 times the number of periods minus the periods since the highest high, all divided by the number of periods. With N = 25, a high set on the latest bar gives 100, and a high 5 bars ago gives 80. Aroon Down applies the same formula to the lowest low in the window.
The Aroon oscillator is Aroon Up minus Aroon Down. Its range is -100 to +100, with zero as the midpoint. A positive value means the most recent extreme in the window is a high, and a negative value means it is a low. It is a timing comparison, not a buy or sell rule.
StockCharts uses 25 periods in its Aroon formulas and calls 25 its default parameter. TradingView's support article states no default and uses a 14-day window in its example. Check the input setting on your own platform before you compare values with another chart.
No. A reading of 100 means the highest high in the window occurred on the latest bar. It describes past bars and does not forecast direction. StockCharts describes consistently high readings as prices regularly hitting new highs or lows. That describes past bars, and the pattern can fail.
No. Aroon uses the bar count since the highest high and the lowest low in a window. It does not use volume, so it says nothing about how many shares or contracts traded. Volume is a separate input, and you can read it alongside Aroon on your own chart.