Accountable publisher
Published under the RTX5 Editorial Team byline. It identifies the responsible publishing organization; it does not imply that a named lawyer, regulator, financial adviser, or licensed expert approved this page.
Technical indicators
The detrended price oscillator (DPO) is a price oscillator that compares a past close with a simple moving average calculated at a later bar, so the average is displaced in time. TA-Lib and StockCharts use 20 as the default period, giving a displacement of 11 bars. It is used to study cycle lengths in past bars, not to forecast.
In brief
The DPO is a cycle tool, not a trend line. This guide sets out its formula and displacement, a worked example with assumed closes, how platforms differ, and what the indicator cannot show.
The detrended price oscillator, usually shortened to DPO, compares a closing price with a simple moving average (SMA) that has been displaced in time. StockCharts describes it as the closing price less the value of a displaced moving average, and TradingView's support article describes the same construction.
The purpose is to remove a longer trend from the comparison. It asks how far a past close sits from an average built around the bars near it. The exponential moving average guide covers a different averaging method.
At bar i, the DPO equals the price t bars back minus the N-period simple moving average at bar i. N is the period, and t equals N/2 + 1, using integer division. TA-Lib sets the default N at 20.
TradingView writes the same calculation as the price from N/2 + 1 periods ago minus the N-period SMA, with N chosen by the user.
StockCharts' Stock Market Cycles page says it often helps to set the DPO in line with the cycle being studied, for example a 10-period DPO for 10-day cycle lows. For a different long-cycle tool, see the Coppock curve guide.
A reader counts the bars between two cycle peaks or troughs and compares that count with N. The count describes past bars only and does not fix the next cycle's length.
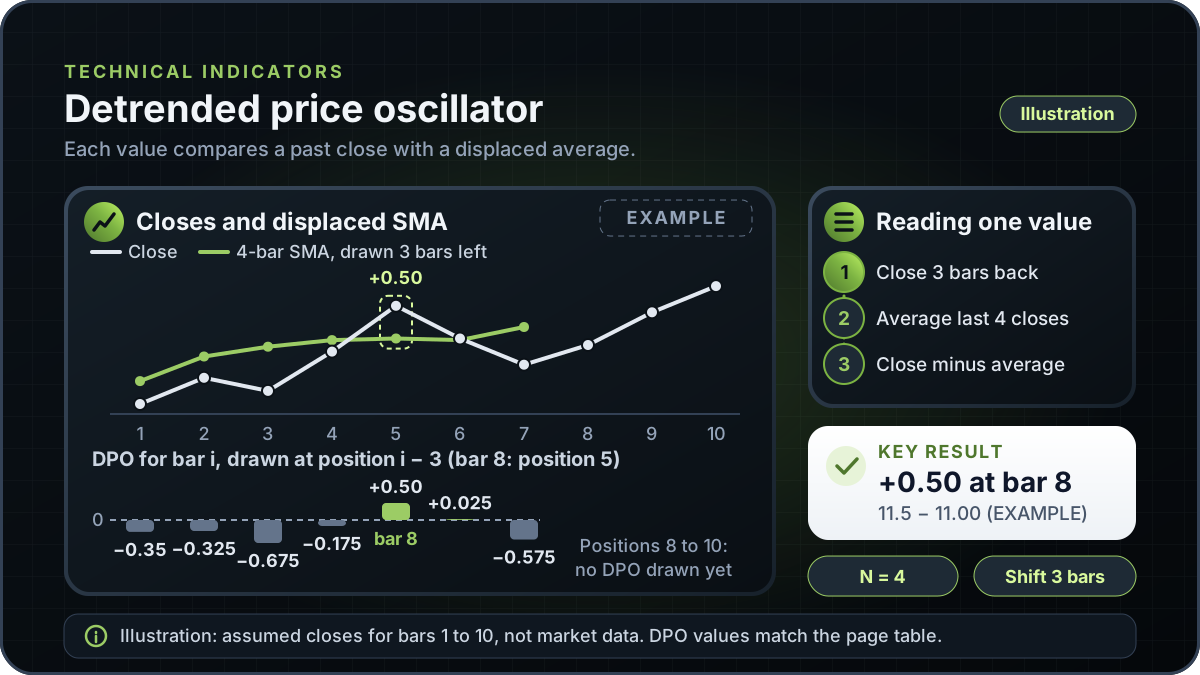
This is an Example with assumed closes, not market data. A 20-period DPO needs more bars than fit in a table, so the example uses N = 4. The displacement is then 4/2 + 1 = 3 bars. Each DPO value compares the close three bars back with the 4-bar SMA ending at the current bar.
The assumed closes for bars 1 to 10 are 10.0, 10.4, 10.2, 10.8, 11.5, 11.0, 10.6, 10.9, 11.4 and 11.8. The first DPO value is at bar 4, the first bar with four closes available for the average.
Check one row. At bar 8 the SMA is (11.5 + 11.0 + 10.6 + 10.9) / 4 = 44.0 / 4 = 11.00. The compared close is bar 5, which is 11.5. The DPO is 11.5 - 11.00 = +0.50. The bar-8 close of 10.9 is inside the average, but it is not the price compared.
| Bar (i) | Compared close (bar i - 3) | 4-bar SMA ending at bar i | DPO at bar i |
|---|---|---|---|
| 4 | 10.0 | 10.350 | -0.35 |
| 5 | 10.4 | 10.725 | -0.325 |
| 6 | 10.2 | 10.875 | -0.675 |
| 7 | 10.8 | 10.975 | -0.175 |
| 8 | 11.5 | 11.000 | +0.50 |
| 9 | 11.0 | 10.975 | +0.025 |
| 10 | 10.6 | 11.175 | -0.575 |
Example arithmetic. Assumed closes for bars 1 to 10: 10.0, 10.4, 10.2, 10.8, 11.5, 11.0, 10.6, 10.9, 11.4, 11.8. Each DPO is the compared close minus the SMA.
The DPO values are negative for bars 4 to 7 and bar 10, and positive for bars 8 and 9. This describes these ten closes only and does not show what bar 11 will do.
TA-Lib says charting packages usually draw each value t bars to the left, a display convention rather than a different series.
The practical effect is at the right-hand edge. For N = 20, the value drawn at the newest bar's position is the DPO of the bar 11 places later. That value needs a 20-bar average over 11 bars that have not printed yet, so the newest 11 positions carry no displayed value. The most recent calculable DPO belongs to the newest bar and is drawn 11 bars to the left. It compares the close 11 bars back with today's 20-bar average.
The references do not all write the same formula, so the table sets each one out.
| Reference | Formula as written | Default period | Displacement and notes |
|---|---|---|---|
| TA-Lib function reference | DPO[i] = P[i - t] - SMA(P, N)[i], with t = N/2 + 1 (integer division) | 20; accepted range 2 to 100,000 | Charts usually draw the value t bars to the left, which TA-Lib calls a display convention. |
| TA-Lib causal variant, same function reference | P[i] - SMA(P, N)[i - t] | Same N as the main series | Displaces the average into the past instead of the price. TA-Lib describes it and says it is not implemented there. |
| StockCharts ChartSchool, Stock Market Cycles | Closing price less the displaced N-period moving average | 20 (SharpCharts default parameter) | Average displaced to the past by N/2 + 1; a 20-day DPO is displaced 11 days. The StockCharts DPO article's formula line says 'in the future', a conflict this page does not follow. |
| TradingView support article | Price from (N/2 + 1) periods ago minus the N-period SMA | N is user-defined; no default stated | Has a Centered input. When it is off, the line shifts right to match current price. |
| MQL5 Code Base, DPO (code 27) | CLOSE - SMA(CLOSE, N/2 + 1), with N the cycle period | No default; recommends 21 or less | Writes N/2 + 1 inside the SMA term. The page states no displacement rule. |
The MetaTrader 5 help pages for oscillators and trend indicators list no Detrended Price Oscillator, so this page states no MetaTrader 5 default.
The safe comparison is to fix N, record the platform and its version, and confirm whether the moving-average length and the displacement are both applied. Two lines with the same N can differ if one platform uses N/2 + 1 as the average length.
The MQL5 code page says, in its definition of N, 'if N is equal 12, then DPO corresponds to the DiNapoli Detrend Oscillator'. That is MQL5's claim. The other references on this page name no originator, so this page does not confirm who devised the DPO.
Readers look at whether the line sits above or below zero, and at the spacing of peaks and troughs against the chosen period. The TradingView support article says the indicator is not necessarily intended to generate signals.
This page does not treat a zero-line cross as a signal. A DPO line records past closes against a displaced average. The arithmetic can be checked, but the next cycle cannot be read from it. For another average-based tool with its own construction, see the MACD guide.
A sensible next step is to choose a period from a cycle you have measured on your own chart, write down the platform's formula, and reproduce the table's arithmetic in a spreadsheet before you rely on any line.
This guide explains detrended price oscillator in general and does not describe an RTX5 feature. No RTX5 release record confirms which indicators, chart types or alerts the product includes. RTX5 is Orrnn's trading terminal and broker-technology product. Its Windows desktop client is in preview, and the web and mobile clients are planned. A Google Play listing for Android is published, but the mobile client has no approved release record yet; check the product-availability record before relying on any RTX5 feature.
Check RTX5 product availabilityTrust and methodology
We want you to be able to identify who owns the page, inspect the evidence, understand how tools were used, and challenge anything that looks wrong or out of date.
Published under the RTX5 Editorial Team byline. It identifies the responsible publishing organization; it does not imply that a named lawyer, regulator, financial adviser, or licensed expert approved this page.
5 primary references are listed on this page with context about what each one supports. The source set was checked on .
Automation and AI may help organize research, outline a page, or edit language. They are not treated as sources, are not presented as human experts, and do not remove the publisher's responsibility for the final page.
If a statement is incomplete, unsupported, or outdated, send the exact URL, sentence, and supporting evidence through our contact route. Read the full editorial and corrections policy.
Sources were checked on 10 November 2026. They explain market rules and concepts; they do not certify RTX5 or provide individual financial advice.
TA-Lib uses 20 as the default period, and the StockCharts DPO example also uses 20. With N = 20, the displacement is 11 bars, because N/2 + 1 with integer division gives 11. The TradingView support article uses a user-defined N and states no default. Check your own platform's default before you compare values.
The displacement is N/2 + 1, using integer division, so an even period and the odd number after it share the same shift. For N = 20 and N = 21 the displacement is 11 bars. The close being compared sits t bars before the average calculated at the current bar.
No single reading is a buy or sell signal, and this page does not treat zero-line crosses as signals. The TradingView support article says the DPO is not necessarily intended to be a signal-generating indicator. Use the DPO to describe the spacing of past cycles, not to expect what price will do next.
On a chart that draws each value t bars to the left, a bar's value needs an average from t bars later. The newest t bars have no such average yet. For N = 20, the last 11 bars have no displayed DPO value.
This guide explains the detrended price oscillator in general and does not describe an RTX5 feature. No RTX5 release record confirms which indicators or chart types the product includes. The Windows desktop client is in preview, and the web and mobile clients are planned. A Google Play listing for Android is published, but the mobile client has no approved release record yet. Check the product-availability record before you rely on any RTX5 feature.
Set the period to 4 and confirm that the platform uses the close, an SMA whose length equals the period, and a displacement of 3 bars. The example uses assumed closes, so a live chart will not reproduce its numbers. Test the arithmetic on the ten closes in the table in a spreadsheet first, then compare the platform's output with that result.