Accountable publisher
Published under the RTX5 Editorial Team byline. It identifies the responsible publishing organization; it does not imply that a named lawyer, regulator, financial adviser, or licensed expert approved this page.
Technical indicator
The Ichimoku Cloud, also called Ichimoku Kinko Hyo, is a chart overlay with five lines. Goichi Hosoda published it in his 1969 book. The shaded cloud is formed by Senkou Span A and Senkou Span B, which are plotted 26 periods ahead. The indicator is calculated from past prices, so it describes the market rather than predicting it.
In brief
Ichimoku Kinko Hyo draws five lines and a shaded cloud on the price chart. This guide sets out each line, its formula and default period, and the limits that its sources state.
The Ichimoku Cloud is a chart overlay, also written Ichimoku Kinko Hyo. StockCharts describes it as developed by the journalist Goichi Hosoda and published in his 1969 book. StockCharts also calls the cloud the Kumo.
The overlay is drawn on the price chart itself, and every line is calculated from the same bars as the price. If you are new to the wider subject, start with what is trading, then return here for the Ichimoku-specific parts.
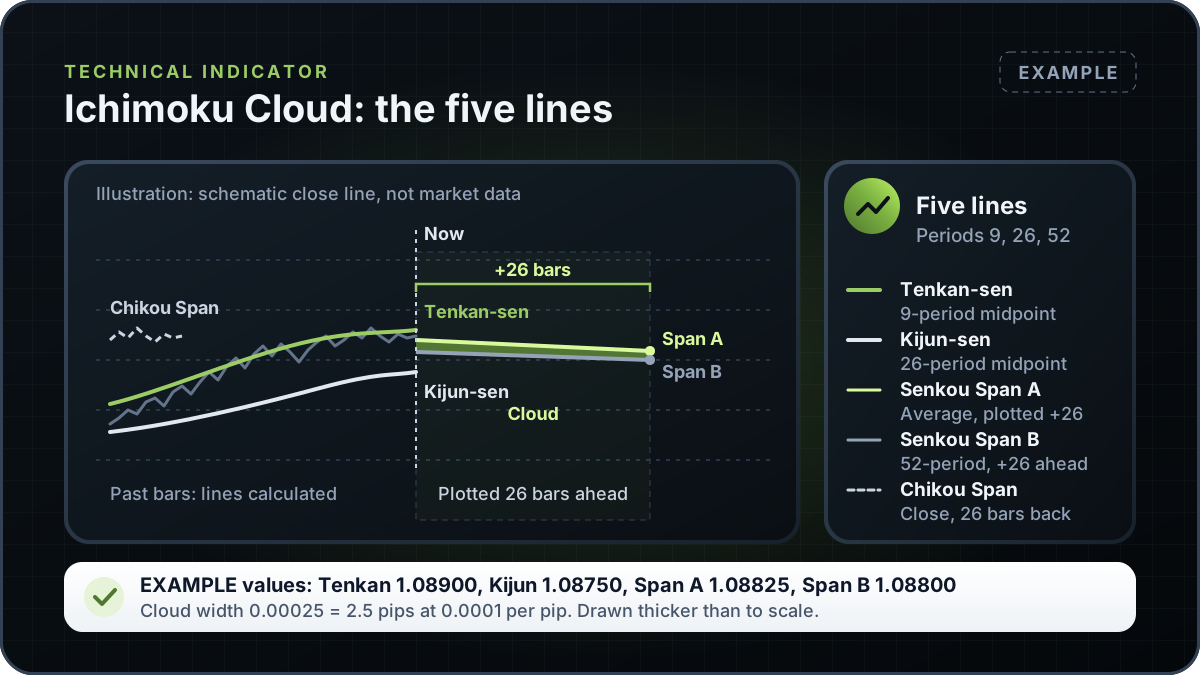
Ichimoku has five lines. Three are midpoints of a highest high and a lowest low over a set number of periods. Senkou Span A averages two of the others. Chikou Span is simply the closing price moved back in time. A period is one bar on the chart you are using, so nine periods on a daily chart means nine daily bars.
| Line | Formula | Plotting | What the source says it shows |
|---|---|---|---|
| Tenkan-sen (Conversion Line) | (9-period highest high + 9-period lowest low) / 2 | Current bar | The shorter of the two midpoint lines; StockCharts says it follows price action most closely. |
| Kijun-sen (Base Line) | (26-period highest high + 26-period lowest low) / 2 | Current bar | The slower midpoint line; StockCharts says it trails the faster Conversion Line. |
| Senkou Span A (Leading Span A) | (Tenkan-sen + Kijun-sen) / 2 | 26 periods ahead | The faster of the two cloud boundaries. |
| Senkou Span B (Leading Span B) | (52-period highest high + 52-period lowest low) / 2 | 26 periods ahead | The slower of the two cloud boundaries. |
| Chikou Span (Lagging Span) | The closing price | 26 periods back | Close plotted in the past. The StockCharts page gives no interpretation rule for it. |
Formulas and periods from StockCharts ChartSchool, with the 9, 26 and 52 inputs matching the MQL5 iIchimoku sample code. Verified on 10 November 2026.
The formulas are arithmetic on past bars. None of them contains a forecast, a target or a rule for entering a trade.
This is an Example with invented high and low values, not market data. Suppose the highest high of the last nine bars is 1.09200 and the lowest low is 1.08600. Tenkan-sen = (1.09200 + 1.08600) / 2 = 1.08900.
Suppose the last 26 bars have a highest high of 1.09500 and a lowest low of 1.08000. Kijun-sen = (1.09500 + 1.08000) / 2 = 1.08750. Both values are calculated on the current bar.
In this Example Tenkan-sen (1.08900) sits above Kijun-sen (1.08750), and Span A sits above Span B, so under the StockCharts colour convention the cloud would be green. The numbers only show how the arithmetic works. They do not show a trade signal, and a real chart will not repeat them.
The cloud is the area between Senkou Span A and Senkou Span B. Because both spans are plotted 26 periods ahead, the cloud at any bar was calculated 26 periods earlier. The part of the cloud that sits ahead of the price is therefore built from older bars, which is why the displacement matters when you read it.
StockCharts states that the cloud is shaded green when Span A is above Span B, and red when Span B is above Span A. The colour only shows which span is higher at that point. It does not measure how strong a move is or how likely it is to continue.
Sources describe the cloud in terms of trend and levels. TradingView says price above the cloud indicates an uptrend and price below it indicates a downtrend. StockCharts says the cloud defines support and resistance and identifies trend direction, and it adds that the cloud can provide a view of future support or resistance because it is shifted forward.
StockCharts also describes a Conversion Line and Base Line crossover as the classic signal. It says to look for signals in the direction of the bigger trend, and that the crossover can be rare in a strong trend. It also says that signals counter to the existing trend are deemed weaker. A chart reader can name the crossover, but the source does not show that it works.
The Chikou Span is closing price moved back 26 periods. It is a comparison with past prices, and no cited source states a rule for reading it. Read it as a plotted line, not as a forecast.
Trend and level tools such as support and resistance answer related questions in different ways. Tenkan-sen and Kijun-sen are midpoints of highs and lows, not averages of closes, so they differ from an exponential moving average. For the momentum side of the comparison, see what is MACD.
The defaults are 9, 26 and 52 periods, with a displacement of 26. The four sources cited in this page state them differently. The table shows what each one gives, so you can check the numbers against the source rather than trust a summary.
| Source | Tenkan-sen | Kijun-sen | Senkou Span B | Displacement |
|---|---|---|---|---|
| StockCharts ChartSchool | 9 periods | 26 periods | 52 periods | 26 periods |
| MQL5 iIchimoku documentation (sample inputs) | 9 | 26 | 52 | 26, from the kijun_sen shift in the sample code |
| MetaTrader 5 help (Ichimoku Kinko Hyo) | No number stated; the help page says four time intervals are used and assigns the first to Tenkan-sen | No number stated; assigned the second interval | No number stated; assigned the third interval | No number stated; the spans and Chikou Span shift by the second interval |
| TradingView support (Ichimoku Cloud) | Not stated in the article text | Not stated in the article text | Not stated in the article text | Leading Span A and Leading Span B: "plot this data point 26 periods in the future"; lagging span: closing price "26 periods in the past" |
No cited source gives a different default. The sources differ in what they state, not in the numbers. Verified on 10 November 2026.
Changing the inputs changes every line and the cloud. The MQL5 sample exposes the three periods as input parameters, which shows that they are settings, not fixed properties of the market.
This guide explains the Ichimoku Cloud in general and does not describe an RTX5 feature. No RTX5 release record confirms which indicators, chart types or alerts the product includes. RTX5 is Orrnn's trading terminal and broker-technology product. Its Windows desktop client is in preview, and the web and mobile clients are planned. A Google Play listing for Android is published, but the mobile client has no approved release record yet; check the product-availability record before relying on any RTX5 feature.
Check RTX5 product availabilityTrust and methodology
We want you to be able to identify who owns the page, inspect the evidence, understand how tools were used, and challenge anything that looks wrong or out of date.
Published under the RTX5 Editorial Team byline. It identifies the responsible publishing organization; it does not imply that a named lawyer, regulator, financial adviser, or licensed expert approved this page.
5 primary references are listed on this page with context about what each one supports. The source set was checked on .
Automation and AI may help organize research, outline a page, or edit language. They are not treated as sources, are not presented as human experts, and do not remove the publisher's responsibility for the final page.
If a statement is incomplete, unsupported, or outdated, send the exact URL, sentence, and supporting evidence through our contact route. Read the full editorial and corrections policy.
Sources were checked on 10 November 2026. They explain market rules and concepts; they do not certify RTX5 or provide individual financial advice.
It shows five lines and a shaded area on a price chart. TradingView and StockCharts describe the cloud as a way to read trend direction and areas of support and resistance. It is calculated from past bars. The lines do not show a forecast, and the chart does not state how long a reading will last.
StockCharts states that the journalist Goichi Hosoda developed the indicator and published it in his 1969 book. The indicator is also called Ichimoku Kinko Hyo, and StockCharts calls the cloud itself the Kumo. The MetaTrader 5 help page is titled Ichimoku Kinko Hyo, the same name used in this guide.
The standard periods are 9 for Tenkan-sen, 26 for Kijun-sen and 52 for Senkou Span B, with a displacement of 26 periods. The MQL5 documentation uses these values as sample inputs. They are settings, and a chart can use other values.
No. The Ichimoku Cloud is calculated from past prices. TradingView's support article says the indicator is rooted in historical data and that nothing in it calculates a predictive forecast of future trends. A reading describes the chart, not the next move.
StockCharts says the cloud can define support and resistance, and that its forward shift gives a view of future levels. A level on the cloud is still a chart reading, and price can move through it. StockCharts also says signals against the existing trend are weaker.
Yes, and the MQL5 sample code treats the periods as inputs. Changing 9, 26 or 52 changes every line and the cloud, so the readings will differ from the defaults used in the sources. Record the settings you use so the chart can be compared fairly.