Accountable publisher
Published under the RTX5 Editorial Team byline. It identifies the responsible publishing organization; it does not imply that a named lawyer, regulator, financial adviser, or licensed expert approved this page.
Research summary
Searching for how to make money day trading? The studies below do not show a reliable method. Regulators and researchers in India, Taiwan and Brazil report that most individual day traders lose money over the periods they measured, and only a small minority make profits that persist.
In brief
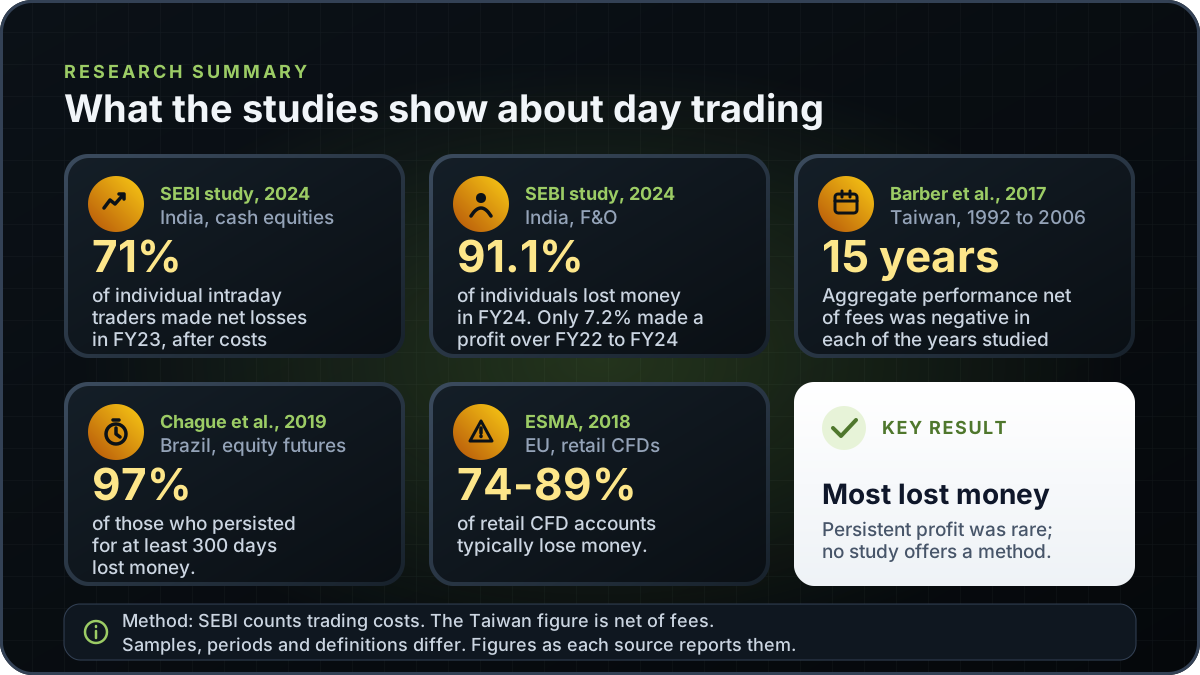
Official and academic studies of day traders show that losses are common. Here is what each study measured, its headline figure and what the numbers cannot tell you.
A day trading success rate is not one number. Each study defines success differently, measures a different group and covers a different period. The table below sets out the five studies checked for this page, using the year and figure each source reports.
| Study and year | Market and sample | Finding as reported |
|---|---|---|
| SEBI, Analysis of Intraday trading by Individuals in Equity Cash Segment (July 2024), covering FY19, FY22 and FY23 | Individuals who traded intraday in the NSE equity cash segment, from the top 10 brokers, which accounted for about 86% of individuals in the NSE cash segment in FY23 | 71% of individual intraday traders incurred net losses in FY23, after trading costs. |
| SEBI, Analysis of Profits and Losses in the Equity Derivatives Segment (FY22-FY24), September 2024 | Individual traders in NSE equity futures and options, from a sample of the top 15 brokers, FY22 to FY24 | 91.1% of individuals lost money in FY24. Only 7.2% made a profit over the three years. Over FY22 to FY24, 1.13 crore unique individuals incurred a combined net loss of Rs 1.81 lakh crore, inclusive of transaction costs. |
| Barber, Lee, Liu, Zhang and Odean, Do Day Traders Rationally Learn About Their Ability? (working paper, October 2017) | Complete transaction data for the Taiwan stock market, 1992 to 2006 | Aggregate day trader performance net of fees was negative in each of the 15 years studied. Nearly three-quarters of day trading volume was generated by unsuccessful day traders with at least 10 days of experience. |
| Chague, De-Losso and Giovannetti, Day Trading for a Living? (working paper 2019_47) | Individuals who began day trading Brazilian equity futures between 2013 and 2015 and persisted for at least 300 days | 97% of those who persisted for at least 300 days lost money. Only 0.4% earned more than a bank teller, at US$54 a day. The authors found no evidence of learning by day trading. |
| ESMA, press release on binary options and CFD restrictions (27 March 2018) | Retail CFD accounts in EU jurisdictions, from national regulators' analyses | National regulators' analyses of CFD trading showed that 74-89% of retail CFD accounts typically lose money. ESMA's leverage limits for retail clients ran from 30:1 to 2:1. |
Each row reports the source's own figure and year. The ESMA range refers to retail CFD trading. The academic figures come from working papers, and a later published version may differ.
Read the table as a set of different questions, not as one answer. The SEBI studies ask how many individuals made a net loss in a year. The Taiwan and Brazil studies ask what happens to traders who keep trading. The ESMA figure describes retail CFD accounts, which is a different product from exchange-traded day trading.
Cost treatment matters. The SEBI cash-segment study defines net profit or loss as trading profit or loss minus the cost of trading, which includes brokerage, exchange fees, the SEBI turnover fee, stamp duty, STT and GST. The SEBI derivatives study counts net losses inclusive of transaction costs. The Taiwan study reports aggregate performance net of fees. A reader who compares these figures without checking the cost basis may draw the wrong conclusion.
Persistence changes the result. The Brazilian figure of 97% applies to the people who persisted in day trading for at least 300 days, not to everyone who started. Traders who quit early are not in that group. A study that follows only survivors can show a different picture from one that counts all starters, so check whether each number is a share of starters or a share of those who persisted.
Samples are also national. The Indian studies use broker data from one national market, the Taiwan study uses one market over 1992 to 2006, and the Brazilian study follows people who began day trading one futures market between 2013 and 2015. None of these is a global sample, and none tells you how a market or product you choose will behave today.
The studies do not say that nobody profits from day trading. They say that persistent profit is rare. The Taiwan authors estimate that predictably profitable day traders make up less than 3% of all day traders on an average day, and they account for under 10% of day trading volume. They were identified by an extensive history of past profits. The studies do not offer a method that others could copy.
SEBI's derivatives study reports the same pattern in a different form. Only 1% of individual F&O traders earned profits exceeding Rs 1 lakh over FY22 to FY24, after adjusting for transaction costs. The gap between a profitable minority and a loss-making majority is the central finding across the studies, and it is why a single winning period is weak evidence.
More activity was linked with worse results in the SEBI cash-segment study. In FY23, 80% of traders carrying out more than 500 intraday trades in a year were loss-makers. Loss-makers also placed more trades on average than profit-makers. Loss-makers who traded very frequently spent 72% over and above their trading losses on trading costs.
Experience does not clearly fix the problem either. Among traders who traded intraday in FY19, FY22 and FY23, SEBI reports that 54% were loss-makers in FY23. The Taiwan authors found that experienced traders with losing records kept trading at nearly the same rate as profitable ones, and they write that persistent trading in the face of losses is not consistent with models of rational learning.
Some day trading products use leverage, which lets a small deposit control a larger position. Leverage magnifies both gains and losses, so it raises the stakes of a losing trade. The mechanics are set out in what is leverage in trading.
ESMA's 2018 measures restricted CFDs for retail clients in the EU and prohibited binary options. They set leverage limits on opening a position from 30:1 down to 2:1, varying with the volatility of the underlying, and a standard close-out at 50% of minimum required margin per account. ESMA described these as temporary measures, so check your national regulator for the rules that apply to you now. The product itself is explained in what is a CFD.
Rules on intraday margin and day trader designations differ by country and have changed. The pattern day trader rule page covers the US position and explains why an older rule may still be quoted in some places.
The studies describe what happened to groups of traders. They do not tell any one person what to do. Their practical lesson is about cost, frequency and the habit of checking results against a full record, including losing periods. Traders who ignore costs or do not count their losing periods are the ones these studies warn about.
Before you risk money, learn the mechanics of day trading and measure your own results. Day trading explained gives the definition, and paper trading lets you record simulated trades without capital at risk.
RTX5 is Orrnn's trading terminal and broker-technology product. Its Windows desktop client is in preview, and the web and mobile clients are planned. A Google Play listing for Android is published, but the mobile client has no approved release record yet; check the product-availability record before relying on any RTX5 feature. RTX5 is not a broker and does not hold client money. The studies on this page are third-party research and do not come from an RTX5 feature, and RTX5 does not offer a method for making money day trading.
Check RTX5 product availabilityTrust and methodology
We want you to be able to identify who owns the page, inspect the evidence, understand how tools were used, and challenge anything that looks wrong or out of date.
Published under the RTX5 Editorial Team byline. It identifies the responsible publishing organization; it does not imply that a named lawyer, regulator, financial adviser, or licensed expert approved this page.
6 primary references are listed on this page with context about what each one supports. The source set was checked on .
Automation and AI may help organize research, outline a page, or edit language. They are not treated as sources, are not presented as human experts, and do not remove the publisher's responsibility for the final page.
If a statement is incomplete, unsupported, or outdated, send the exact URL, sentence, and supporting evidence through our contact route. Read the full editorial and corrections policy.
Sources were checked on 9 November 2026. They explain market rules and concepts; they do not certify RTX5 or provide individual financial advice.
Only a small minority in these studies made a profit that persisted. SEBI's derivatives study found that only 7.2% of individual traders made a profit across FY22 to FY24. The Brazilian study found that 97% of those who persisted in day trading for at least 300 days lost money. A profit in one period does not show that a trader can repeat it.
There is no single figure. The studies measure different things: the share of traders with a net loss in one year, the share profitable over several years, or the share of volume from profitable traders. Compare the definition, the period and the cost treatment before you compare any two numbers.
The SEBI studies do. SEBI's cash-segment study counts brokerage, exchange fees, the SEBI turnover fee, stamp duty, STT and GST as costs of trading, and it found that these costs worsened loss-makers' trading losses by 57% in FY23. Check each study's cost basis before you compare results.
No. Each study covers a past period in a particular market. The Taiwan data ends in 2006, and the Brazilian study follows people who began day trading between 2013 and 2015. Markets, rules and broker costs change. The studies describe what happened to the people measured, and they do not predict what will happen to any account.
This page is educational and is not personal advice. If you are considering day trading, learn the basics with day trading explained and practise with paper trading first. Check your costs and your broker's margin terms, and only risk money you can afford to lose.